
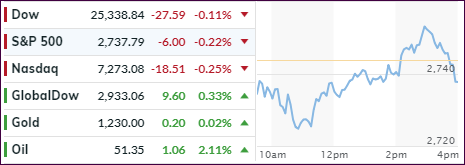
- Moving the markets
The November Fed minutes revealed that a rate hike was on the horizon, but the path from then on forward was uncertain and that “monetary policy in 2019 was not on a pre-set course.” Additionally, it was made clear that the expectation of 3 hikes was “flexible” and could change, if the economic picture shifted dramatically.
Nothing new there, but the markets took it as less uncertainty than we had prior to yesterday’s announcement, and see-sawed around the unchanged line all day before closing slightly in the red.
Still, the indexes have now recovered to where they are hovering at critical levels with their key moving averages. That simply means that these levels could serve as resistance points or, if broken solidly, as a base for new advances and a break back into bullish territory.
Headline news will likely make that decision, as words like G-20, Fed, Trump and Trade are the ones that will affect market direction soon. Interest rates took a dive with the 10-year bond yield dropping below the 3% level for the first time since the middle of September, before rallying off that point to close at 3.03%. That is an amazing collapse in yields when considering that earlier this month we were at 3.24%.
This makes me wonder if economic conditions are as solid as advertised, because if they were, yields would continue to rise and not drop. Consider, we have a plunge in pending home sales to the weakest in 5 years, jobless claims soaring to 8-month highs, while some car manufacturers are closing plants and laying off workers. These are signs of weakening conditions that may need an assist from the Fed in form of lower rates. Is that why the Fed showed a softer “dovish” side yesterday?
- ETFs in the Spotlight
In case you missed the announcement and description of this section, you can read it here again.
It features 10 broadly diversified and sector ETFs from my HighVolume list as posted every Saturday. Furthermore, they are screened for the lowest MaxDD% number meaning they have been showing better resistance to temporary sell offs than all others over the past year.
The below table simply demonstrates the magnitude with which some of the ETFs are fluctuating regarding their positions above or below their respective individual trend lines (%M/A). A break below, represented by a negative number, shows weakness, while a break above, represented by a positive percentage, shows strength.
For hundreds of ETF choices, be sure to reference Thursday’s StatSheet.
Year to date, here’s how our original candidates have fared:
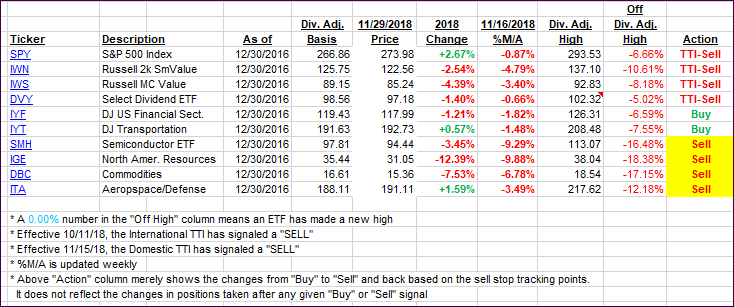
Again, the %M/A column above shows the position of the various ETFs in relation to their respective long-term trend lines, while the trailing sell stops are being tracked in the “Off High” column. The “Action” column will signal a “Sell” once the -8% point has been taken out in the “Off High” column. For more volatile sector ETFs, the trigger point is -10%.
- Trend Tracking Indexes (TTIs)
Our Trend Tracking Indexes (TTIs) slipped a tad and remain in bearish territory.
Here’s how we closed 11/29/2018:
Domestic TTI: -0.84% below its M/A (last close -0.55%)—Sell signal effective 11/15/2018
International TTI: -3.33% below its M/A (last close -3.36%)—Sell signal effective 10/11/2018
Disclosure: I am obliged to inform you that I, as well as my advisory clients, own some of the ETFs listed in the above table. Furthermore, they do not represent a specific investment recommendation for you, they merely show which ETFs from the universe I track are falling within the guidelines specified.
Contact Ulli