
- Moving the markets
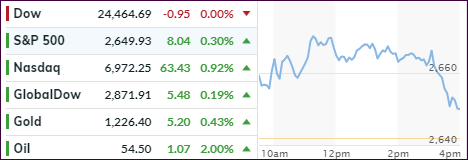
With the Dow having lost about 950 points over the past 2 days, it was time for the major indexes to bounce back, at least for one session, in order to recapture some of the ugly losses. That attempt turned into a head fake as, late in the day, momentum reversed with the Dow giving back all its early gains.
But, the S&P 500 managed to recoup +0.30%, while the beaten down Nasdaq fared the best by adding +0.92%. Obviously, pre-Thanksgiving volume was low, so we should not put too much value into today’s action. Historically, however, this week went down as the worst start to Thanksgiving week in 45 years.
Yesterday’s decline erased YTD gains for the Dow and S&P 500, but the Nasdaq is hanging on to a 1.1% advance. For the month of November, things look bleak with the 3 major indexes being down led by the Nasdaq with -3.9%. Ouch.
As I have repeatedly said, equity risk has increased and the bear market, as I define it with my Trend Tracking Indexes (TTIs), is upon us, which makes this the perfect time to be out of the markets and on the sidelines.
Happy Thanksgiving!
- ETFs in the Spotlight
In case you missed the announcement and description of this section, you can read it here again.
It features 10 broadly diversified and sector ETFs from my HighVolume list as posted every Saturday. Furthermore, they are screened for the lowest MaxDD% number meaning they have been showing better resistance to temporary sell offs than all others over the past year.
The below table simply demonstrates the magnitude with which some of the ETFs are fluctuating regarding their positions above or below their respective individual trend lines (%M/A). A break below, represented by a negative number, shows weakness, while a break above, represented by a positive percentage, shows strength.
For hundreds of ETF choices, be sure to reference Thursday’s StatSheet.
Year to date, here’s how our original candidates have fared:
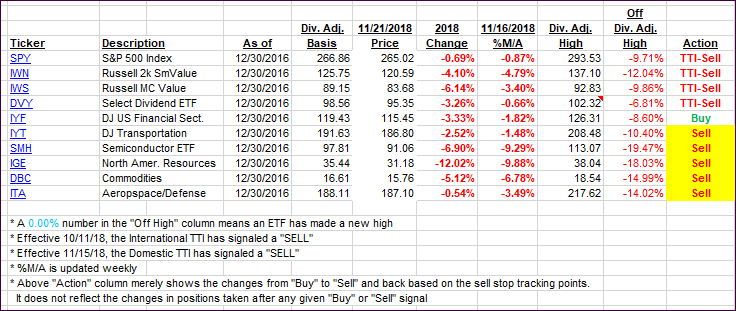
Again, the %M/A column above shows the position of the various ETFs in relation to their respective long-term trend lines, while the trailing sell stops are being tracked in the “Off High” column. The “Action” column will signal a “Sell” once the -8% point has been taken out in the “Off High” column. For more volatile sector ETFs, the trigger point is -10%.
- Trend Tracking Indexes (TTIs)
Our Trend Tracking Indexes (TTIs) improved slightly but remain stuck in bear territory.
Here’s how we closed 11/21/2018:
Domestic TTI: -3.46% below its M/A (last close -4.06%)—Sell signal effective 11/15/2018
International TTI: -5.58% below its M/A (last close -5.87%)—Sell signal effective 10/11/2018
Disclosure: I am obliged to inform you that I, as well as my advisory clients, own some of the ETFs listed in the above table. Furthermore, they do not represent a specific investment recommendation for you, they merely show which ETFs from the universe I track are falling within the guidelines specified.
Contact Ulli