
- Moving the markets
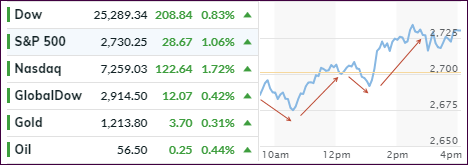
Equities headed south in early trading, which was the validation confirming yesterday’s “Sell” signal for “broadly diversified domestic equity ETFs.” The markets dumped at first then see-sawed higher in what can be considered a drop, pop, drop and pop kind of session, during which all 3 major indexes ended in the green for a change ending a skid of 5 consecutive losing days for the S&P 500.
Our main directional indicator, the Domestic TTI, recovered a bit but remains stuck on the bearish side of its trend line. This will keep us on the sidelines until the TTI breaks back above it and shows some staying power at the same time. With the current wild swings in the market, and a projected year-end rally, we may find ourselves back in sooner rather than later.
Today’s roller-coaster was all about the latest version of the trade headlines. First, there was news of a trade truce causing a market bounce, then a drop, as the trade truce was denied, followed by a rally on news that next batch of tariffs have been shelved for the time being.
This back and forth surrounding one event make it questionable whether this late rebound will have legs or falter again, as we’ve seen in the recent past. Additionally, there is ongoing tightness of financial conditions which, if not resolved, may have a negative effect on equities, if this chart forecast is correct.
- ETFs in the Spotlight
In case you missed the announcement and description of this section, you can read it here again.
It features 10 broadly diversified and sector ETFs from my HighVolume list as posted every Saturday. Furthermore, they are screened for the lowest MaxDD% number meaning they have been showing better resistance to temporary sell offs than all others over the past year.
The below table simply demonstrates the magnitude with which some of the ETFs are fluctuating regarding their positions above or below their respective individual trend lines (%M/A). A break below, represented by a negative number, shows weakness, while a break above, represented by a positive percentage, shows strength.
For hundreds of ETF choices, be sure to reference Thursday’s StatSheet.
Year to date, here’s how our candidates have fared so far:
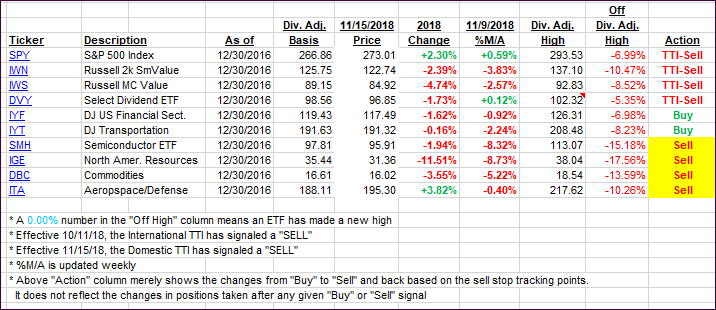
Again, the %M/A column above shows the position of the various ETFs in relation to their respective long-term trend lines, while the trailing sell stops are being tracked in the “Off High” column. The “Action” column will signal a “Sell” once the -8% point has been taken out in the “Off High” column. For more volatile sector ETFs, the trigger point is -10%.
- Trend Tracking Indexes (TTIs)
Our Trend Tracking Indexes (TTIs) improved thanks to a late-day rally but both remain in bear market territory.
Here’s how we closed 11/15/2018:
Domestic TTI: -1.35% below its M/A (last close -2.18%)—Sell signal effective 11/15/2018
International TTI: -4.37% below its M/A (last close -4.72%)—Sell signal effective 10/11/2018
Disclosure: I am obliged to inform you that I, as well as my advisory clients, own some of the ETFs listed in the above table. Furthermore, they do not represent a specific investment recommendation for you, they merely show which ETFs from the universe I track are falling within the guidelines specified.
Contact Ulli