
- Moving the markets
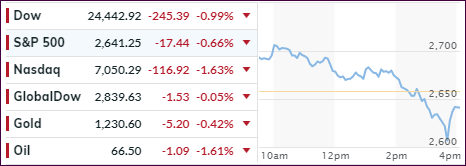
A nice early morning bounce seemed to have a soothing effect on the bulls, with the Dow up almost 400 points. Unfortunately, that did not last, as a mid-day fade took the major indexes back to the unchanged line when, suddenly, downward momentum accelerated pushing the Dow momentarily to -500 points, before a last-minute rally limited the day’s damage.
Nevertheless, the trading range for the Dow was over 900 points leaving all indexes in the red for the session. As I mentioned before, when we are in bear market territory, as determined by our Trend Tracking Indexes (section 3), not only can anything happen but also with a speed and magnitude that can be simply breathtaking, as we saw this afternoon. The adage that “stocks take the escalator up and the elevator down” certainly rang true today.
Things started to collapse after US-China trade headlines suggested that Trump might put tariffs on ‘all’ Chinese goods, if his next scheduled meeting with the Chinese Premier Xi does not bring the desired results. Other news about an UK digital service tax did not encourage buyers to put their chips down.
The VIX spiked above 25, and the widely held FANG stocks continued their swan dive and are now down -24% from their highs in late September. All 4 of them are now in bear market territory and have come off their highs as follows: FB (-35.5%), AMZN (-25.9%), NFLX (-33.3%), GOOGL (-20.3%).
The bulls have now set their sights on hopes of good news from the ongoing earnings season, expecting bullish momentum to be restored. The other possible game changer could be the expiration of the blackout period, which is the time frame just prior and shortly after earnings season during which corporations suspend stock buybacks. As these stocks exit this period, it is assumed that their historical buying spree will continue and lift overall market sentiment.
Right now, however, the bears maintain the upper hand, and we will watch this debacle unfold from the sidelines.
- ETFs in the Spotlight
In case you missed the announcement and description of this section, you can read it here again.
It features 10 broadly diversified and sector ETFs from my HighVolume list as posted every Saturday. Furthermore, they are screened for the lowest MaxDD% number meaning they have been showing better resistance to temporary sell offs than all others over the past year.
The below table simply demonstrates the magnitude with which some of the ETFs are fluctuating regarding their positions above or below their respective individual trend lines (%M/A). A break below, represented by a negative number, shows weakness, while a break above, represented by a positive percentage, shows strength.
For hundreds of ETF choices, be sure to reference Thursday’s StatSheet.
Year to date, here’s how our candidates have fared so far:
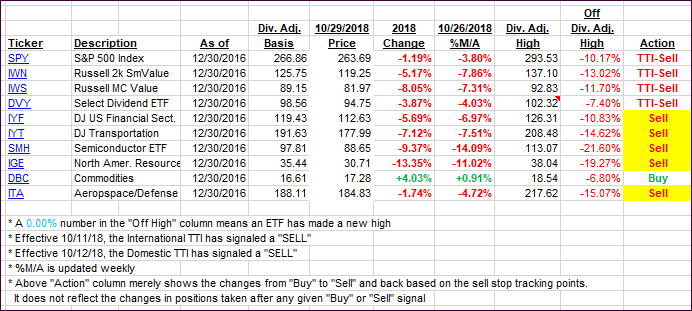
Again, the %M/A column above shows the position of the various ETFs in relation to their respective long-term trend lines, while the trailing sell stops are being tracked in the “Off High” column. The “Action” column will signal a “Sell” once the -8% point has been taken out in the “Off High” column. For more volatile sector ETFs, the trigger point is -10%.
- Trend Tracking Indexes (TTIs)
Our Trend Tracking Indexes (TTIs) changed only slightly due to a comeback rally in the last 30 minutes of the session.
Here’s how we closed 10/29/2018:
Domestic TTI: -5.31% below its M/A (last close -5.35%)—Sell signal effective 10/12/2018
International TTI: -7.08% below its M/A (last close -6.97%)—Sell signal effective 10/11/2018
Disclosure: I am obliged to inform you that I, as well as my advisory clients, own some of the ETFs listed in the above table. Furthermore, they do not represent a specific investment recommendation for you, they merely show which ETFs from the universe I track are falling within the guidelines specified.
Contact Ulli