
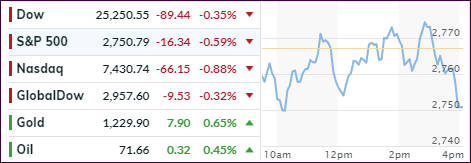
- Moving the markets
Traders were a nervous bunch today after the S&P 500 bounced off the lows last Friday and came to rest right on top of its 200-day M/A, which for many represents the dividing line between bullish and bearish territory.
Our Domestic Trend Tracking Index (TTI) already dipped below its own trend line last Thursday generating the signal to exit “broadly diversified domestic equity ETFs.” We eliminated most but are still holding some positions to not get caught in a whip-saw signal. These are slated to be sold as well as soon as I see more downside confirmation.
Today’s session did not offer much of a clue as to future market direction, since the major indexes clung to their respective unchanged lines. However, during the last 30 minutes, the bears appeared to have been unleashed (via Saudi headlines) and pushed the indexes clearly below the day’s trading range and the S&P 500 below its 200-day M/A where it closed for the 2nd time out of the past 3 days.
Looking at this S&P 500 chart, it appears that the bearish momentum has the upper hand for the time being.
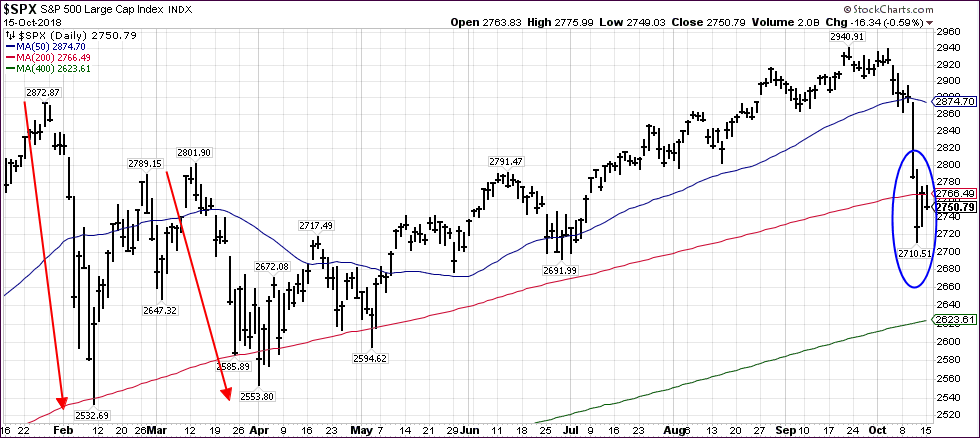
Much technical damage has been done, and it would not surprise me to see that our Domestic TTI was spot on again in indicating the sentiment change from bullish to bearish.
It’s still a little early for a conclusion, but I expect more clarification as this week progresses.
- ETFs in the Spotlight
In case you missed the announcement and description of this section, you can read it here again.
It features 10 broadly diversified and sector ETFs from my HighVolume list as posted every Saturday. Furthermore, they are screened for the lowest MaxDD% number meaning they have been showing better resistance to temporary sell offs than all others over the past year.
The below table simply demonstrates the magnitude with which some of the ETFs are fluctuating regarding their positions above or below their respective individual trend lines (%M/A). A break below, represented by a negative number, shows weakness, while a break above, represented by a positive percentage, shows strength.
For hundreds of ETF choices, be sure to reference Thursday’s StatSheet.
Year to date, here’s how our candidates have fared so far:
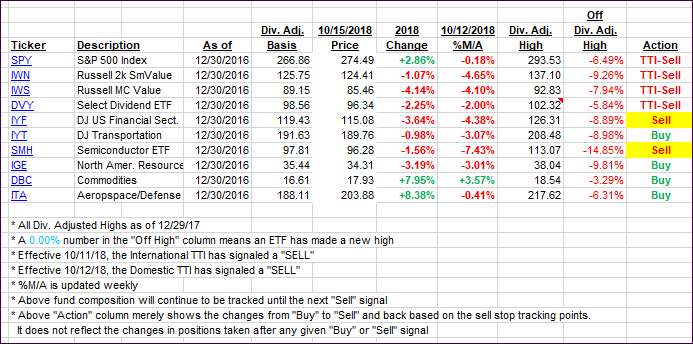
Again, the %M/A column above shows the position of the various ETFs in relation to their respective long-term trend lines, while the trailing sell stops are being tracked in the “Off High” column. The “Action” column will signal a “Sell” once the -8% point has been taken out in the “Off High” column. For more volatile sector ETFs, the trigger point is -10%.
- Trend Tracking Indexes (TTIs)
Our Trend Tracking Indexes (TTIs) slipped deeper into bear market territory.
Here’s how we closed 10/15/2018:
Domestic TTI: -1.71% below its M/A (last close -1.53%)—Sell signal effective 10/12/2018
International TTI: -3.85% below its M/A (last close -3.56%)—Sell signal effective 10/11/2018
Disclosure: I am obliged to inform you that I, as well as my advisory clients, own some of the ETFs listed in the above table. Furthermore, they do not represent a specific investment recommendation for you, they merely show which ETFs from the universe I track are falling within the guidelines specified.
Contact Ulli