
- Moving the markets
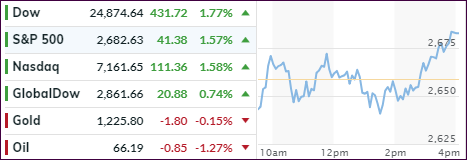
Despite today turning into another roller-coaster ride, with the S&P 500 crossing its unchanged line seven times, the bulls prevailed in the end by pushing the major indexes higher during a last hour attack. For sure, with the brutal selling spree of the past few weeks on traders’ minds, it was about time for a rebound with starch, which is exactly what we saw today.
The assists came from the fact that markets were simply oversold along with news by President Trump that a deal with China on trade “may” be reached. Whether there will be any staying power, or if this was an outlier, are questions which will be answered within the next couple of weeks or so.
Financial news certainly did not contribute to this afternoon’s levitation. Early on, GE’s earnings report was so bad that their dividend was cut, and their stock price was not only hammered by almost -10% but the price threatened to dip into single digits. Here’s a lesson for buy-and-holders: GE’s shares are now unchanged since 1995…
The billionaire masters of high finance and complicated algorithms, namely hedge funds, demonstrated quite some vulnerability during October. Actually, their meltdown accelerated as the Hedge fund index clearly shows. Additionally, this month was their worst month on record. This most likely will cause further redemptions by customers, which means more asset liquidations, an outlook which would support the bearish theme.
In the end, my outlook did not change. The major equity indexes remain stuck below their respective 200-day M/As, joined by MSFT, which tumbled but managed to regain its 200-day M/A. With only one trading day left, the FANG stocks, while mixed today, got bloodied beyond recognition during the month.
It was indeed a red October.
- ETFs in the Spotlight
In case you missed the announcement and description of this section, you can read it here again.
It features 10 broadly diversified and sector ETFs from my HighVolume list as posted every Saturday. Furthermore, they are screened for the lowest MaxDD% number meaning they have been showing better resistance to temporary sell offs than all others over the past year.
The below table simply demonstrates the magnitude with which some of the ETFs are fluctuating regarding their positions above or below their respective individual trend lines (%M/A). A break below, represented by a negative number, shows weakness, while a break above, represented by a positive percentage, shows strength.
For hundreds of ETF choices, be sure to reference Thursday’s StatSheet.
Year to date, here’s how our candidates have fared so far:
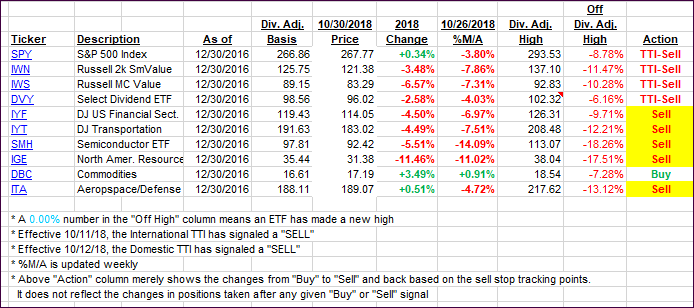
Again, the %M/A column above shows the position of the various ETFs in relation to their respective long-term trend lines, while the trailing sell stops are being tracked in the “Off High” column. The “Action” column will signal a “Sell” once the -8% point has been taken out in the “Off High” column. For more volatile sector ETFs, the trigger point is -10%.
- Trend Tracking Indexes (TTIs)
Our Trend Tracking Indexes (TTIs) jumped as today’s equity rebound was solid and lasted into close.
Here’s how we closed 10/30/2018:
Domestic TTI: -3.48% below its M/A (last close -5.31%)—Sell signal effective 10/12/2018
International TTI: -6.36% below its M/A (last close -7.08%)—Sell signal effective 10/11/2018
Disclosure: I am obliged to inform you that I, as well as my advisory clients, own some of the ETFs listed in the above table. Furthermore, they do not represent a specific investment recommendation for you, they merely show which ETFs from the universe I track are falling within the guidelines specified.
Contact Ulli