
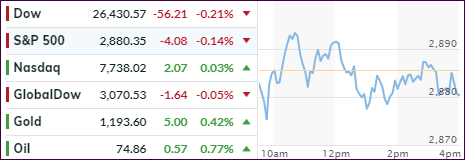
[Chart courtesy of MarketWatch.com]
- Moving the markets
The major indexes tried to get out of their foul mood by staging an early rally, which was rebuffed with the trend for the session being predominantly sideways. The S&P 500 not only extended its losing streak for the fourth day, but also bounced around its 50-day M/A leaving open the possibility that this might serve as a support level.
Keeping a lid on upward momentum were bond yields, which spiked again early on with the 10-year touching 3.26% before fading into the close at 3.20% and creating a bond rally. Despite this intra-session pullback, I think the cat is now out of the bag and higher rates and yields will be our future companions. That also means that these loftier yields, with bonds being perceived to be more risk-free than equities, will compete against them for investor dollars.
Of course, those having been invested in bonds during the lowest of rates are seeing plenty of red numbers, as bond prices got crushed with higher yields. Case in point is the widely held 20-year bond ETF (TLT), which finally bounced back today but still shows a YTD loss of -11.19%, hardly soothing for a “conservative” investment.
In the end, despite equities displaying some chaotic characteristics during this session, the major trend remains bullish based on our Domestic TTI (see section 3).
- ETFs in the Spotlight
In case you missed the announcement and description of this section, you can read it here again.
It features 10 broadly diversified and sector ETFs from my HighVolume list as posted every Saturday. Furthermore, they are screened for the lowest MaxDD% number meaning they have been showing better resistance to temporary sell offs than all others over the past year.
The below table simply demonstrates the magnitude with which some of the ETFs are fluctuating regarding their positions above or below their respective individual trend lines (%M/A). A break below, represented by a negative number, shows weakness, while a break above, represented by a positive percentage, shows strength.
For hundreds of ETF choices, be sure to reference Thursday’s StatSheet.
Year to date, here’s how our candidates have fared so far:

Again, the %M/A column above shows the position of the various ETFs in relation to their respective long-term trend lines, while the trailing sell stops are being tracked in the “Off High” column. The “Action” column will signal a “Sell” once the -8% point has been taken out in the “Off High” column. For more volatile sector ETFs, the trigger point is -10%.
- Trend Tracking Indexes (TTIs)
Our Trend Tracking Indexes (TTIs) slipped as directionless meandering was the theme of the day.
Here’s how we closed 10/09/2018:
Domestic TTI: +2.56% above its M/A (last close +3.05%)—Buy signal effective 4/4/2016
International TTI: -0.40% below its M/A (last close -0.29%)—Buy signal effective 7/26/2018
Disclosure: I am obliged to inform you that I, as well as my advisory clients, own some of the ETFs listed in the above table. Furthermore, they do not represent a specific investment recommendation for you, they merely show which ETFs from the universe I track are falling within the guidelines specified.
Contact Ulli