
- Moving the markets
It truly was an ugly October, despite the hopeful rebound during the past couple of days, which left many traders wondering “are we there yet?” meaning “is the bottom in?” While the answer is elusive, some analysts point to tomorrow as being a make-or-break kind of day.
Why?
As I mentioned before, the FAANG stocks got hammered during October with only one stock in that composite having held up reasonably well, namely Apple, and they are due to report their quarterly results tomorrow. If Apple disappoints and falls, so goes the current theory, the overall market will likely follow. If its results are pleasing, the rally might continue. Again, these are simply wild Wall Street projections.
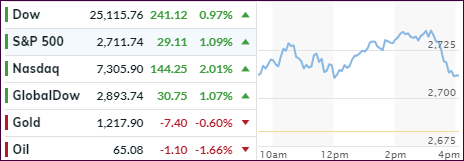
It wasn’t just domestic equities that joined in the rally, but global stocks as well, so everyone got a Halloween treat. Despite the past couple of “green” days, the month was a turbulent one and will go down in history as having seen the biggest losses in global equities since 2008 amounting to some $8 trillion. Still, the big picture shows that, while the world’s stocks (ex-US) are down almost 13% YTD, US equities are unchanged after having erased the entire year’s gains in October.
Technically speaking, the major indexes are still hovering below their respective 200-day M/As leaving the sentiment on the bearish side. This is confirmed by our Trend Tracking Indexes (section 3), which improved their positions during this 2-day rebound but are still stuck below the line, which separates the bulls from the bears.
We need to see more upside momentum, along with some staying power, before a new “Buy” signal will be generated.
- ETFs in the Spotlight
In case you missed the announcement and description of this section, you can read it here again.
It features 10 broadly diversified and sector ETFs from my HighVolume list as posted every Saturday. Furthermore, they are screened for the lowest MaxDD% number meaning they have been showing better resistance to temporary sell offs than all others over the past year.
The below table simply demonstrates the magnitude with which some of the ETFs are fluctuating regarding their positions above or below their respective individual trend lines (%M/A). A break below, represented by a negative number, shows weakness, while a break above, represented by a positive percentage, shows strength.
For hundreds of ETF choices, be sure to reference Thursday’s StatSheet.
Year to date, here’s how our candidates have fared so far:
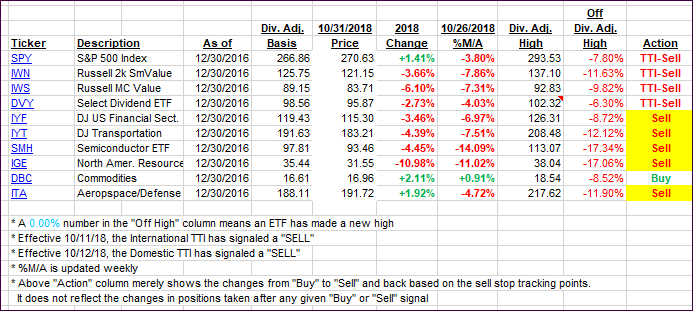
Again, the %M/A column above shows the position of the various ETFs in relation to their respective long-term trend lines, while the trailing sell stops are being tracked in the “Off High” column. The “Action” column will signal a “Sell” once the -8% point has been taken out in the “Off High” column. For more volatile sector ETFs, the trigger point is -10%.
- Trend Tracking Indexes (TTIs)
Our Trend Tracking Indexes (TTIs) improved, with the 2-day rally helping bullish sentiment, but our current bearish view remains intact as the below numbers indicate.
Here’s how we closed 10/31/2018:
Domestic TTI: -2.92% below its M/A (last close -3.48%)—Sell signal effective 10/12/2018
International TTI: -5.32% below its M/A (last close -6.36%)—Sell signal effective 10/11/2018
Disclosure: I am obliged to inform you that I, as well as my advisory clients, own some of the ETFs listed in the above table. Furthermore, they do not represent a specific investment recommendation for you, they merely show which ETFs from the universe I track are falling within the guidelines specified.
Contact Ulli