
- Moving the markets
If you followed the news over the weekend, you would have gotten a pretty good indication as to today’s market direction. Trade war talk made the headlines Saturday morning as Trump’s fresh round of tariffs caused a reaction from the Chinese, as they now refused to send two delegations to Washington while elaborating that “pressure tactics won’t induce them to cooperate” and pledging that Beijing will “avoid negotiating under threat,” and ending with “we hope that the US side will take measures to correct its mistakes.”
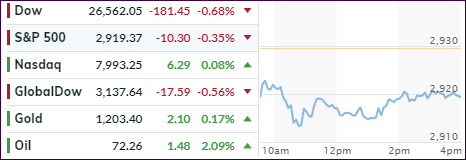
That was enough to kill some of last week’s exuberance in the markets and south we went with the Dow faring the worst, while the Nasdaq managed to crawl out of an early hole. However, in the bigger scheme of things the losses were modest and did not impact our investing strategy, but interest in stocks was sapped, at least for this session. It remains to be seen if there is more fallout to come as this verbal tug-of-war is sure to continue.
The US Dollar was in for a wild ride with ZH describing the action as follows: The Dollar index was sliding lower as Europe opened (China closed), spiked lower on EUR gains after Draghi inflation comments, only to surge higher for the rest of the day on safety concerns following Rosenstein’s resignation headlines…
The 10-year bond yield rose a tad but remains stuck in its recent trading range. I think the odds have now increased of a further breakout to the upside, since it appears that the markets have ‘gotten used to’ a plus 3% yield without much slippage to the downside. Eventually, that picture will change, but for right now the bullish theme for stocks remains intact.
- ETFs in the Spotlight
In case you missed the announcement and description of this section, you can read it here again.
It features 10 broadly diversified and sector ETFs from my HighVolume list as posted every Saturday. Furthermore, they are screened for the lowest MaxDD% number meaning they have been showing better resistance to temporary sell offs than all others over the past year.
The below table simply demonstrates the magnitude with which some of the ETFs are fluctuating regarding their positions above or below their respective individual trend lines (%M/A). A break below, represented by a negative number, shows weakness, while a break above, represented by a positive percentage, shows strength.
For hundreds of ETF choices, be sure to reference Thursday’s StatSheet.
Year to date, here’s how our candidates have fared so far:

Again, the %M/A column above shows the position of the various ETFs in relation to their respective long-term trend lines, while the trailing sell stops are being tracked in the “Off High” column. The “Action” column will signal a “Sell” once the -8% point has been taken out in the “Off High” column. For more volatile sector ETFs, the trigger point is -10%.
- Trend Tracking Indexes (TTIs)
Our Trend Tracking Indexes (TTIs) headed south as bullish momentum waned.
Here’s how we closed 09/24/2018:
Domestic TTI: +4.63% above its M/A (last close +5.85%)—Buy signal effective 4/4/2016
International TTI: +1.74% above its M/A (last close +2.29%)—Buy signal effective 7/26/2018
Disclosure: I am obliged to inform you that I, as well as my advisory clients, own some of the ETFs listed in the above table. Furthermore, they do not represent a specific investment recommendation for you, they merely show which ETFs from the universe I track are falling within the guidelines specified.
Contact Ulli