
- Moving the markets
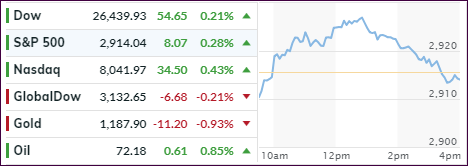
An early rally was rebuffed mid-day when bullish momentum faded, and the indexes headed south. For a while, it looked like we’d be ending up in the red again, but last hour buying halted the S&P 500’s 4-session skid, and we closed modestly in the green.
Some of this weakness was a hangover from yesterday; more specifically the Fed’s decision to stay the course on hiking interest rates. Some economic data released this morning did not help the bullish theme, such as Pending Home Sales dropping 1.8% MoM, which was just about 4 times worse than expected and reaching their lowest level since Oct. 2014.
This was followed by a surge of the Trade Deficit, which ballooned to $75.8 billion in August vs. expectations of $70.6 billion. In historical context, this is close to the all-time 2008 record high deficit of $76,025 billion. You think this might add some fire or urgency to the current trade war talks?
Italy made headlines today, as they defied Europe’s regulation on budget deficits, which are pegged to a maximum of 2% of GDP. However, the Italian governing parties agreed on a 2019 budget deficit of 2.4%, clearly above the agreed upon ceiling setting up a potential skirmish with an unknown outcome.
The immediate consequence was a drop in the Euro and a surge in the US Dollar, which extended its bounce back to 2-week highs. US bond yields were not affected and dropped slightly.
Tomorrow is the last trading day of September, and we’ll be staring October in the face, a month which has demonstrated in the past that it can be a bull market killer. It does not necessarily have to turn out that way, but in my view, it pays to be prepared by having an exit strategy should a major hiccup occur.
- ETFs in the Spotlight
In case you missed the announcement and description of this section, you can read it here again.
It features 10 broadly diversified and sector ETFs from my HighVolume list as posted every Saturday. Furthermore, they are screened for the lowest MaxDD% number meaning they have been showing better resistance to temporary sell offs than all others over the past year.
The below table simply demonstrates the magnitude with which some of the ETFs are fluctuating regarding their positions above or below their respective individual trend lines (%M/A). A break below, represented by a negative number, shows weakness, while a break above, represented by a positive percentage, shows strength.
For hundreds of ETF choices, be sure to reference Thursday’s StatSheet.
Year to date, here’s how our candidates have fared so far:
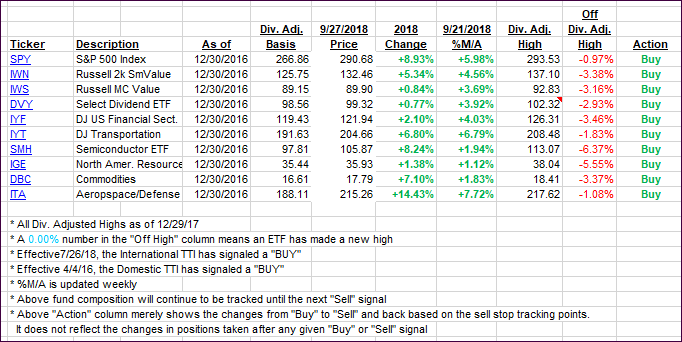
Again, the %M/A column above shows the position of the various ETFs in relation to their respective long-term trend lines, while the trailing sell stops are being tracked in the “Off High” column. The “Action” column will signal a “Sell” once the -8% point has been taken out in the “Off High” column. For more volatile sector ETFs, the trigger point is -10%.
- Trend Tracking Indexes (TTIs)
Our Trend Tracking Indexes (TTIs) were mixed with the Domestic one inching higher and the International one sliding a tad.
Here’s how we closed 09/27/2018:
Domestic TTI: +3.96% above its M/A (last close +3.95%)—Buy signal effective 4/4/2016
International TTI: +1.57% above its M/A (last close +1.82%)—Buy signal effective 7/26/2018
Disclosure: I am obliged to inform you that I, as well as my advisory clients, own some of the ETFs listed in the above table. Furthermore, they do not represent a specific investment recommendation for you, they merely show which ETFs from the universe I track are falling within the guidelines specified.
Contact Ulli