
- Moving the markets
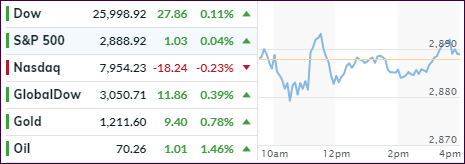
After yesterday’s rebound, the major indexes struggled to crawl above their respective unchanged lines after a weak start to the session. The Dow and S&P 500 succeeded, while the Nasdaq lagged and closed slightly in the red due to Apple’s struggles. Overall, it was simply a lackluster day with neither bulls nor bears showing any interest in flexing their muscles.
Apple was the center of attention presenting new products, but the “lack of innovation” sent the shares to a -1.24% loss. Other areas of the tech sector got clobbered too, namely semiconductors (SMH), which used to my favorite holding until we sold it back in February. SMH not only gave back -1.15% but also broke below a 4-month support line, although it managed to close above it.
In the financial arena, Goldman Sachs stood out by recording its 11th down day in a row, a new record losing streak that helped the GSIBs (Global Systemically Important Banks) to drop -23% from January.
Not to be outdone, the Asia Pacific Stock Index fared only slightly better by having fallen 10 straight days, which equals the longest losing streak in its history. Looks like that record will be beaten…
Treasury yields dropped modestly, while the dollar headed south after a weaker CPI reading and renewed hopes that trade talks will begin again in earnest.
- ETFs in the Spotlight
In case you missed the announcement and description of this section, you can read it here again.
It features 10 broadly diversified and sector ETFs from my HighVolume list as posted every Saturday. Furthermore, they are screened for the lowest MaxDD% number meaning they have been showing better resistance to temporary sell offs than all others over the past year.
The below table simply demonstrates the magnitude with which some of the ETFs are fluctuating regarding their positions above or below their respective individual trend lines (%M/A). A break below, represented by a negative number, shows weakness, while a break above, represented by a positive percentage, shows strength.
For hundreds of ETF choices, be sure to reference Thursday’s StatSheet.
Year to date, here’s how our candidates have fared so far:
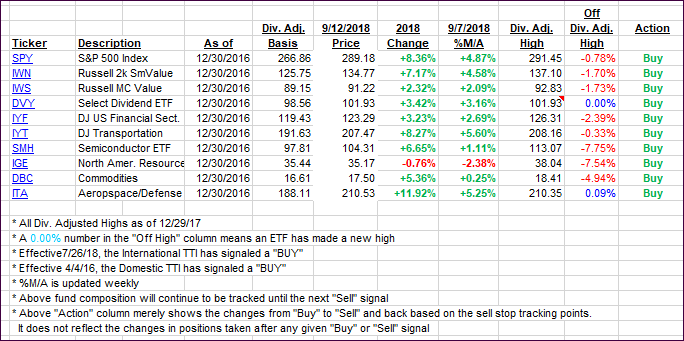
Again, the %M/A column above shows the position of the various ETFs in relation to their respective long-term trend lines, while the trailing sell stops are being tracked in the “Off High” column. The “Action” column will signal a “Sell” once the -8% point has been taken out in the “Off High” column. For more volatile sector ETFs, the trigger point is -10%.
- Trend Tracking Indexes (TTIs)
Our Trend Tracking Indexes (TTIs) both improved despite this having been a lackluster session.
Here’s how we closed 09/12/2018:
Domestic TTI: +4.91% above its M/A (last close +4.72%)—Buy signal effective 4/4/2016
International TTI: -0.99% below its M/A (last close -1.32%)—Buy signal effective 7/26/2018
Disclosure: I am obliged to inform you that I, as well as my advisory clients, own some of the ETFs listed in the above table. Furthermore, they do not represent a specific investment recommendation for you, they merely show which ETFs from the universe I track are falling within the guidelines specified.
Contact Ulli