
- Moving the markets
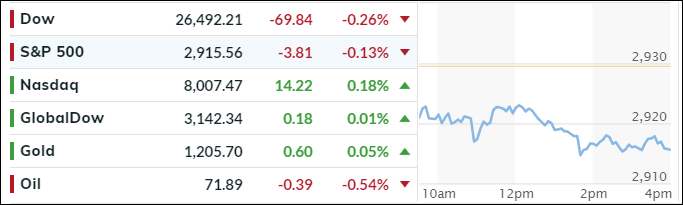
The markets diverged a little bit as the Dow and S&P 500 ended up in the red, while the Nasdaq bucked the trend and closed in the green. However, aimless meandering best describes today’s session with anxiety rising ahead of the Fed’s decision on interest rates tomorrow.
Ignoring the continued trade tensions between the US and China, the markets so far have managed to hover around all-time highs, even though this verbal mudslinging could spiral into a full-blown trade war, which would then result in reduced profits for international corporations and be a supporting meme for the bearish crowd.
With the Fed’s verdict on the directions of interest rates being out due tomorrow, the 10-year bond yield jumped 3 basis points to close at 3.10% and is now in striking distance of taking out its 7 year high. While a hike is somewhat priced in, a lot of hope exists that the Fed will skip this one and enact another one in December. We’ll find out tomorrow around 11:15 AM…
- ETFs in the Spotlight
In case you missed the announcement and description of this section, you can read it here again.
It features 10 broadly diversified and sector ETFs from my HighVolume list as posted every Saturday. Furthermore, they are screened for the lowest MaxDD% number meaning they have been showing better resistance to temporary sell offs than all others over the past year.
The below table simply demonstrates the magnitude with which some of the ETFs are fluctuating regarding their positions above or below their respective individual trend lines (%M/A). A break below, represented by a negative number, shows weakness, while a break above, represented by a positive percentage, shows strength.
For hundreds of ETF choices, be sure to reference Thursday’s StatSheet.
Year to date, here’s how our candidates have fared so far:
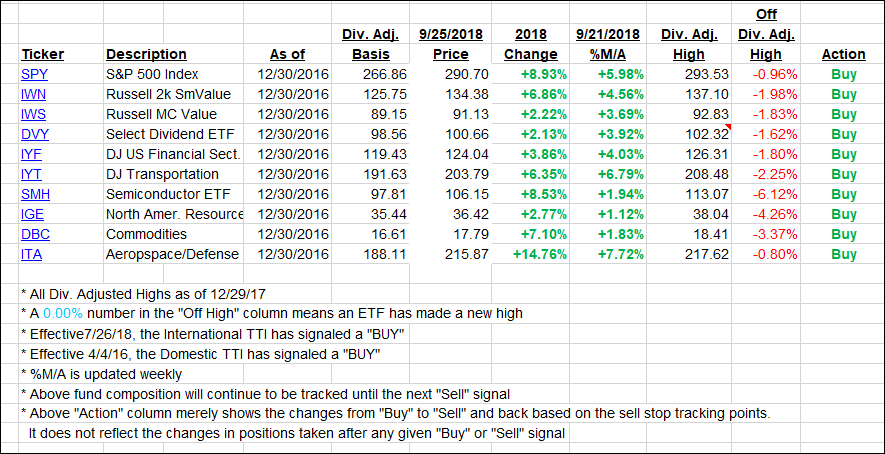
Again, the %M/A column above shows the position of the various ETFs in relation to their respective long-term trend lines, while the trailing sell stops are being tracked in the “Off High” column. The “Action” column will signal a “Sell” once the -8% point has been taken out in the “Off High” column. For more volatile sector ETFs, the trigger point is -10%.
- Trend Tracking Indexes (TTIs)
Our Trend Tracking Indexes (TTIs) showed a mixed picture as the Domestic one retreated while the International one advanced,
Here’s how we closed 09/25/2018:
Domestic TTI: +4.35% above its M/A (last close +4.63%)—Buy signal effective 4/4/2016
International TTI: +1.89% above its M/A (last close +1.74%)—Buy signal effective 7/26/2018
Disclosure: I am obliged to inform you that I, as well as my advisory clients, own some of the ETFs listed in the above table. Furthermore, they do not represent a specific investment recommendation for you, they merely show which ETFs from the universe I track are falling within the guidelines specified.
Contact Ulli