- Moving the markets
I felt that yesterday’s rebound had the smell of a dead-cat-bounce and, based on today’s carnage, that seems to have been accurate—at least for the time being. Despite assurances to the opposite, the “C” word, as in contagion, was suddenly on investors’ minds, as concerns about Turkey’s currency crisis and US/China trade tensions made their presence felt.
The damage was not limited to equities but also to energy, which was the worst performing sector in the S&P with crude oil getting pounded at the rate of over 3%. The major indexes, while off to a poor start after the opening, managed to limit some losses by crawling back but not reaching the unchanged line.
Globally, the outcome was similar with stocks not just falling to 6-week lows but also breaking below major averages, which affected our Domestic TTI by confirming that a new “Sell” signal indeed has been triggered. More in section 3 below.
Contagion is a distinct possibility as a result of the fallout from Turkey’s currency destruction, which already has affected the European banks and, which are now in bear market territory meaning they have come off their highs by more than 20%.
Taking this a step further, stocks of GSIBs, also known as Globally Systemic Important Banks, have dropped 23% off their highs with no end in sight. Remember, these are banks that must be supported by governments at all costs, or things may turn real ugly very fast—economically speaking that is.
Even the VIX appeared to have woken up from a summer snooze by spiking to 17 but settling back down to the 15 area. Benefiting from this wild trading day were interest rates, which dropped as the 10-year bond yield settled down 3 basis points to 2.86%.
As I pointed out yesterday, only a few US banks have direct involvement in Turkey, so this is currently viewed only as one more addition to global uncertainties, of which there are plenty. I don’t think this will simply go away or be resolved quickly, so we must be alert to this being only one domino that can have serious effects on the European banking system and by extension, US banks as well.
- ETFs in the Spotlight
In case you missed the announcement and description of this section, you can read it here again.
It features 10 broadly diversified and sector ETFs from my HighVolume list as posted every Saturday. Furthermore, they are screened for the lowest MaxDD% number meaning they have been showing better resistance to temporary sell offs than all others over the past year.
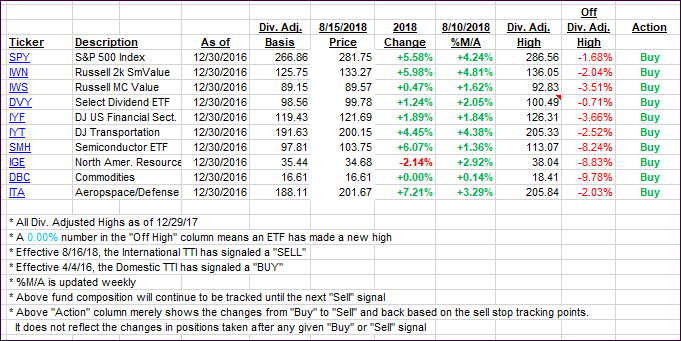
The below table simply demonstrates the magnitude with which some of the ETFs are fluctuating regarding their positions above or below their respective individual trend lines (%M/A). A break below, represented by a negative number, shows weakness, while a break above, represented by a positive percentage, shows strength.
For hundreds of ETF choices, be sure to reference Thursday’s StatSheet.
Year to date, here’s how our candidates have fared so far:
Again, the %M/A column above shows the position of the various ETFs in relation to their respective long-term trend lines, while the trailing sell stops are being tracked in the “Off High” column. The “Action” column will signal a “Sell” once the -8% point has been taken out in the “Off High” column. For more volatile sector ETFs, the trigger point is -10%.
- Trend Tracking Indexes (TTIs)
Our Trend Tracking Indexes (TTIs) headed south with the International one taking a dive and confirming its recent break below its long-term term trend line as the signal I have been waiting for. A new “Sell” signal for the International TTI will be effective as of tomorrow bringing to an end this short “buy” cycle, which can now be considered a whip-saw.
Since we had very limited exposure, this did not affect us much. Of course, should I see a massive recovery in the morning, I will hold off liquidating the small positions we hold.
Here’s how we closed 08/15/2018:
Domestic TTI: +2.34% above its M/A (last close +2.77%)—Buy signal effective 4/4/2016
International TTI: -2.35% below its M/A (last close -0.80%)—Sell signal effective 8/16/2018
Disclosure: I am obliged to inform you that I, as well as my advisory clients, own some of the ETFs listed in the above table. Furthermore, they do not represent a specific investment recommendation for you, they merely show which ETFs from the universe I track are falling within the guidelines specified.
Contact Ulli

