
- Moving the markets
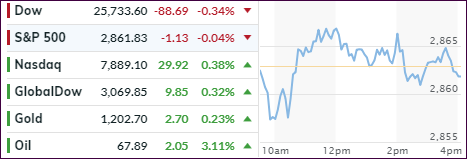
The major indexes hugged the unchanged line for most of the day but were not able to remain above it at closing. The exception was the Nasdaq, which managed to notch another positive session.
The Dow’s and S&P’s pullbacks were modest and influenced by the Fed’s decision to maintain its hawkish stance. The released minutes indicate that if economic data points stay strong “it would likely soon be appropriate to take another step in removing policy accommodation.” Translation: Our planned rate hikes remain on track.
However, they issued one disclaimer in stating that “any tightening will have to pause if the US trade tensions with partners continue to escalate.” So, there you have it. Nothing has changed from the prior meeting, and they will act according to their interpretation of the events as they unfold.
Overall, the markets have managed to overcome some of the obstacles in the recent months, namely the back and forth tug-of-war with our various trading partners, which so far have not affected the earnings season. Now, the latest debacle has surfaced in the form of a possible legal drama surrounding Trump and his personal attorney, a saga which is sure to be regurgitated over and over my MSM, but it’s not clear if it will have any impact on equities.
The US Dollar’s trend reversal continued as it dipped to its lowest level in 2 weeks, while interest rates dropped with the 10-year yield slipping 3 basis points to end at 2.82%. However, over the past 2 weeks bonds have decoupled from stocks as this chart shows. We will have to wait and see who is right…
Looking at the big picture is economist David Rosenberg, who summed things up like this:
“With the sub-par resale home sale report, the running tally so far this month shows 12 data-points missing consensus views to the downside; 5 beating; and 3 in-line. If that characterizes a strong economy, I’d be interested to see what a weak one looks like.”
- ETFs in the Spotlight
In case you missed the announcement and description of this section, you can read it here again.
It features 10 broadly diversified and sector ETFs from my HighVolume list as posted every Saturday. Furthermore, they are screened for the lowest MaxDD% number meaning they have been showing better resistance to temporary sell offs than all others over the past year.
The below table simply demonstrates the magnitude with which some of the ETFs are fluctuating regarding their positions above or below their respective individual trend lines (%M/A). A break below, represented by a negative number, shows weakness, while a break above, represented by a positive percentage, shows strength.
For hundreds of ETF choices, be sure to reference Thursday’s StatSheet.
Year to date, here’s how our candidates have fared so far:
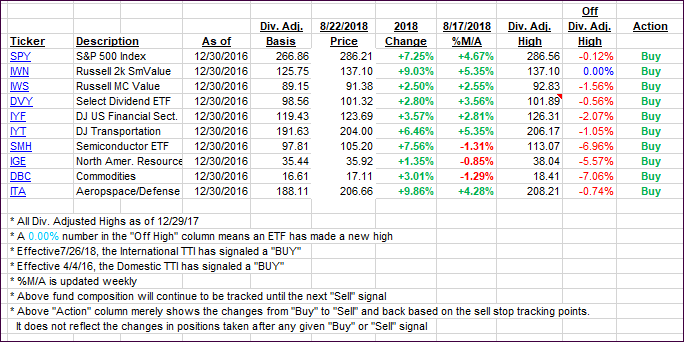
Again, the %M/A column above shows the position of the various ETFs in relation to their respective long-term trend lines, while the trailing sell stops are being tracked in the “Off High” column. The “Action” column will signal a “Sell” once the -8% point has been taken out in the “Off High” column. For more volatile sector ETFs, the trigger point is -10%.
- Trend Tracking Indexes (TTIs)
Our Trend Tracking Indexes (TTIs) headed north with especially the International making a nice move and closing in striking distance of crossing back above its trendline.
Here’s how we closed 08/22/2018:
Domestic TTI: +2.89% above its M/A (last close +2.81%)—Buy signal effective 4/4/2016
International TTI: -0.24% below its M/A (last close -0.44%)—Buy signal effective 7/26/2018
Disclosure: I am obliged to inform you that I, as well as my advisory clients, own some of the ETFs listed in the above table. Furthermore, they do not represent a specific investment recommendation for you, they merely show which ETFs from the universe I track are falling within the guidelines specified.
Contact Ulli