
- Moving the markets
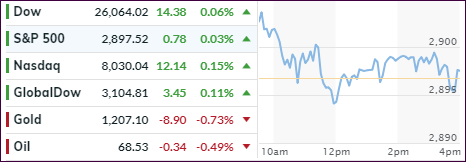
It comes as no surprise that, after yesterday’s strong run-up, the major indexes took a bit of a breather, however, they still managed to close in the green, despite dipping below the unchanged line several times during the session.
So far, it looks that this month may turn out to be the second-best August since 2009, a very interesting occurrence, especially when considering the ever widening gap between the S&P 500 and the collapse of US economic data, which is hardly awe inspiring (hat tip to ZH for these charts).
So, the markets appear to be driven by other factors, and not sound fundamentals. Today, a small assist came from a measure of consumer confidence that hit a nearly 18-year high and was an exception to the slumping data points of the recent past.
The foreign currency debacle continued today led by the Turkish lira plunging -2.35%. This escalated predominantly in the Latin American countries as this chart shows. However, the shakeup was not big enough to make the headlines nor did it affect domestic equities.
Nevertheless, after a slow start, stocks came alive during the second half of August and put in a good performance, despite this being the dog days of summer. With only 3 trading days left, let’s see if traders’ appetites remain bullish.
- ETFs in the Spotlight
In case you missed the announcement and description of this section, you can read it here again.
It features 10 broadly diversified and sector ETFs from my HighVolume list as posted every Saturday. Furthermore, they are screened for the lowest MaxDD% number meaning they have been showing better resistance to temporary sell offs than all others over the past year.
The below table simply demonstrates the magnitude with which some of the ETFs are fluctuating regarding their positions above or below their respective individual trend lines (%M/A). A break below, represented by a negative number, shows weakness, while a break above, represented by a positive percentage, shows strength.
For hundreds of ETF choices, be sure to reference Thursday’s StatSheet.
Year to date, here’s how our candidates have fared so far:
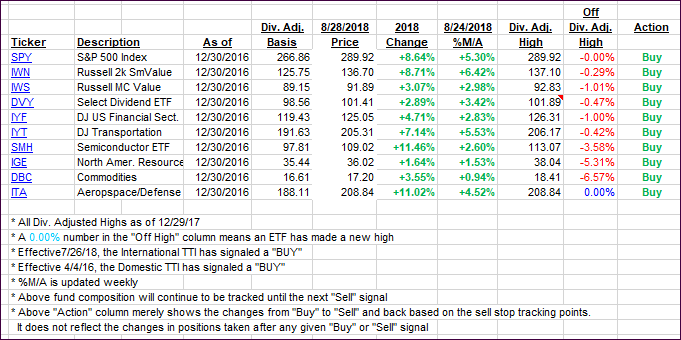
Again, the %M/A column above shows the position of the various ETFs in relation to their respective long-term trend lines, while the trailing sell stops are being tracked in the “Off High” column. The “Action” column will signal a “Sell” once the -8% point has been taken out in the “Off High” column. For more volatile sector ETFs, the trigger point is -10%.
- Trend Tracking Indexes (TTIs)
Our Trend Tracking Indexes (TTIs) edged higher despite the equity markets going through a consolidation session.
Here’s how we closed 08/28/2018:
Domestic TTI: +5.52% above its M/A (last close +5.43%)—Buy signal effective 4/4/2016
International TTI: +0.85% above its M/A (last close +0.75%)—Buy signal effective 7/26/2018
Disclosure: I am obliged to inform you that I, as well as my advisory clients, own some of the ETFs listed in the above table. Furthermore, they do not represent a specific investment recommendation for you, they merely show which ETFs from the universe I track are falling within the guidelines specified.
Contact Ulli