
- Moving the markets
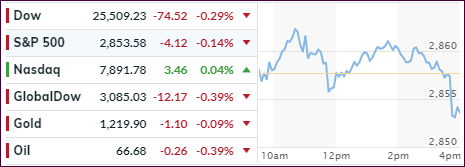
In a repeat from yesterday, the Nasdaq managed to eke out another win, although only by the tiniest of margins, which was enough to log in its 8th straight gain, its best streak since October. The broader market see-sawed all day and ended up diving into the close registering small losses.
Looking at the chart above, it seems apparent that the tug-of-war continued. On one side, we have solid earnings with the number of companies beating estimates being a the highest since 2009, according to JP Morgan.
On the other side, and I hate to have to repeat myself, are the lingering trade tensions between the US and China, where the latest news headline creates either a bullish or bearish effect on market direction causing the see-saw outcome we witnessed today.
The latest economic data were inconsequential with initial jobless claims falling more than expected, while the July producer index (PPI) was flat with expectations calling for a +0.2% rise. That helped bond yields to pull back with the 10-year dropping 3 basis points to 2.93%.
With the focus having been on earnings and interest rates here in the US, I don’t think that the domestic equity markets have priced in any long-term consequences of a prolonged trade war with China, reeling emerging markets and European banking problems. These are all issues that could provide a hefty headwind soon but, for right now, everything seems to be looked at through rose colored glasses.
- ETFs in the Spotlight
In case you missed the announcement and description of this section, you can read it here again.
It features 10 broadly diversified and sector ETFs from my HighVolume list as posted every Saturday. Furthermore, they are screened for the lowest MaxDD% number meaning they have been showing better resistance to temporary sell offs than all others over the past year.
The below table simply demonstrates the magnitude with which some of the ETFs are fluctuating regarding their positions above or below their respective individual trend lines (%M/A). A break below, represented by a negative number, shows weakness, while a break above, represented by a positive percentage, shows strength.
For hundreds of ETF choices, be sure to reference Thursday’s StatSheet.
Year to date, here’s how our candidates have fared so far:
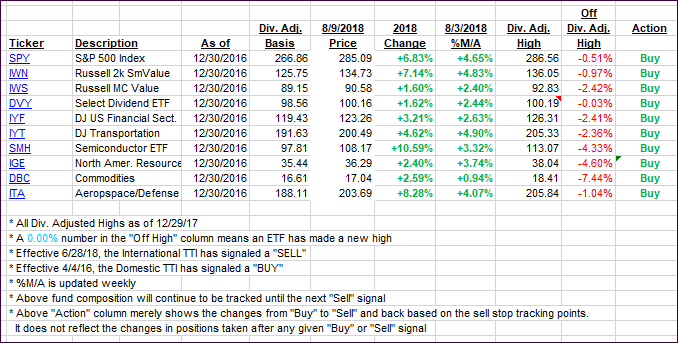
Again, the %M/A column above shows the position of the various ETFs in relation to their respective long-term trend lines, while the trailing sell stops are being tracked in the “Off High” column. The “Action” column will signal a “Sell” once the -8% point has been taken out in the “Off High” column. For more volatile sector ETFs, the trigger point is -10%.
- Trend Tracking Indexes (TTIs)
Our Trend Tracking Indexes (TTIs) moved a tad with no effect on the long-term direction.
Here’s how we closed 08/09/2018:
Domestic TTI: +2.94% above its M/A (last close +2.93%)—Buy signal effective 4/4/2016
International TTI: +0.89% above its M/A (last close +1.11%)—Buy signal effective 7/26/2018
Disclosure: I am obliged to inform you that I, as well as my advisory clients, own some of the ETFs listed in the above table. Furthermore, they do not represent a specific investment recommendation for you, they merely show which ETFs from the universe I track are falling within the guidelines specified.
Contact Ulli