
- Moving the markets
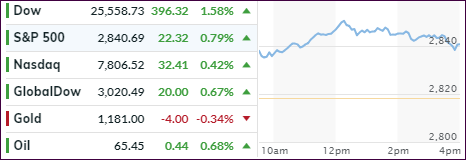
It didn’t take much to get the markets going after yesterday’s drubbing and the see-saw action we’ve seen over the past week. Strong earnings from Walmart and Cisco set the tone early on, and reports of a resumption of US/China trade talks next week provided the ammo to push the major indexes up with the Dow having its best day in some 4 months.
Please note the absurdity in that the trade wars with China have not been resolved in any way, shape or form. It was merely the mention of these talks being reopened again that helped boost overall sentiment and motivated the bulls to come out full force.
The Turkish currency turmoil subsided somewhat as the lira rallied for a 3rd straight session against the dollar. Throwing an assist was Qatar, which provided a lifeline by investing $15 billion in Turkey, after Turkey’s FinMin soothed raw nerves by announcing that “capital controls would be ruled out as a policy option.” That’s a good thing as these would likely promote broad capital flight from an Emerging Market space.
Not all stocks participated in today’s rebound as the FANGs resumed their downtrend thanks to a 3% stumble in Facebook. The FANGs are now within shouting distance of touching their 10% correction level, as you can see here.
Looking at the big picture, there is only one thing that has been responsible for the recent weakness in the markets as well as for the strength over the past 3 years. Take a guess and then see the answer presented in this chart.
- ETFs in the Spotlight
In case you missed the announcement and description of this section, you can read it here again.
It features 10 broadly diversified and sector ETFs from my HighVolume list as posted every Saturday. Furthermore, they are screened for the lowest MaxDD% number meaning they have been showing better resistance to temporary sell offs than all others over the past year.
The below table simply demonstrates the magnitude with which some of the ETFs are fluctuating regarding their positions above or below their respective individual trend lines (%M/A). A break below, represented by a negative number, shows weakness, while a break above, represented by a positive percentage, shows strength.
For hundreds of ETF choices, be sure to reference Thursday’s StatSheet.
Year to date, here’s how our candidates have fared so far:
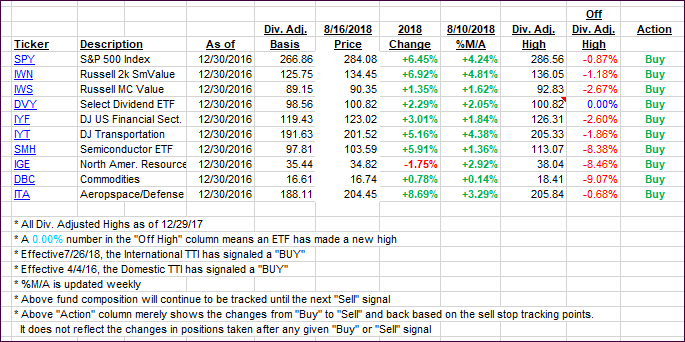
Again, the %M/A column above shows the position of the various ETFs in relation to their respective long-term trend lines, while the trailing sell stops are being tracked in the “Off High” column. The “Action” column will signal a “Sell” once the -8% point has been taken out in the “Off High” column. For more volatile sector ETFs, the trigger point is -10%.
- Trend Tracking Indexes (TTIs)
Our Trend Tracking Indexes (TTIs) rallied as a massive rebound came into play today, not due to any fundamentals, but only based on hope that the USA and China will meet again next week “to talk.”
Nevertheless, the strong bullishness prompted me to hold off declaring the end of the International “Buy” signal. I will wait and see if I can detect more clarity as to the major direction in that arena before making a final call.
Here’s how we closed 08/16/2018:
Domestic TTI: +2.57% above its M/A (last close +2.34%)—Buy signal effective 4/4/2016
International TTI: -1.76% below its M/A (last close -2.35%)—Buy signal effective 7/26/2018
Disclosure: I am obliged to inform you that I, as well as my advisory clients, own some of the ETFs listed in the above table. Furthermore, they do not represent a specific investment recommendation for you, they merely show which ETFs from the universe I track are falling within the guidelines specified.
Contact Ulli