
- Moving the markets
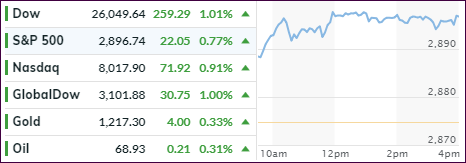
So much for the dog days of summer, as the S&P 500 and Nasdaq closed at record highs for the second day in a row powered by excitement over the new trade deal between the US and Mexico.
The Dow successfully reclaimed the 26k level for the first time since February, while the Nasdaq conquered the 8k milestone, which took only some 5 months to accomplish after the 7k landmark was breached. This makes it the second 1,000-point advance this year, a feat last seen in 1999.
While the new trade deal with our southern neighbor sparked today’s solid advance, optimism from Friday’s Fed announcement that they would “continue its strategy of gradually normalizing its monetary policy,” carried over into today’s session and contributed to the bullish mood.
Additionally, traders are convinced that the economy remains on solid footing, which helped them disregard a variety of headwinds ranging from signs of a weakening housing market, negative headlines, emerging market currency crises and the ever-present trade policy uncertainty.
Interest rates rose with bond yields crawling higher, as the decoupling of the stock market and bond market continues, but the 30-year remains below the 3% level. After peaking mid-August, the US Dollar continued doing an about face by having retreated to the level where it started the month.
Goldman Sachs shed some light as why the markets ripped higher in August. They pointed out that August is typically the busiest month for corporate buy-backs when measured over the last decade. And I thought it was the resilient economy…
- ETFs in the Spotlight
In case you missed the announcement and description of this section, you can read it here again.
It features 10 broadly diversified and sector ETFs from my HighVolume list as posted every Saturday. Furthermore, they are screened for the lowest MaxDD% number meaning they have been showing better resistance to temporary sell offs than all others over the past year.
The below table simply demonstrates the magnitude with which some of the ETFs are fluctuating regarding their positions above or below their respective individual trend lines (%M/A). A break below, represented by a negative number, shows weakness, while a break above, represented by a positive percentage, shows strength.
For hundreds of ETF choices, be sure to reference Thursday’s StatSheet.
Year to date, here’s how our candidates have fared so far:

Again, the %M/A column above shows the position of the various ETFs in relation to their respective long-term trend lines, while the trailing sell stops are being tracked in the “Off High” column. The “Action” column will signal a “Sell” once the -8% point has been taken out in the “Off High” column. For more volatile sector ETFs, the trigger point is -10%.
- Trend Tracking Indexes (TTIs)
Our Trend Tracking Indexes (TTIs) jumped with the International one closing back up above its long-term trend line rewarding us for our patience for not having pulled the “Sell” trigger too early.
The Domestic one raced ahead as well, a portion of which can be attributed to distribution adjustments.
Here’s how we closed 08/27/2018:
Domestic TTI: +5.43% above its M/A (last close +3.01%)—Buy signal effective 4/4/2016
International TTI: +0.75% above its M/A (last close -0.26%)—Buy signal effective 7/26/2018
Disclosure: I am obliged to inform you that I, as well as my advisory clients, own some of the ETFs listed in the above table. Furthermore, they do not represent a specific investment recommendation for you, they merely show which ETFs from the universe I track are falling within the guidelines specified.
Contact Ulli