
- Moving the markets
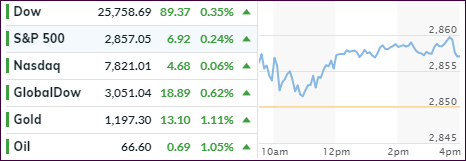
Sentiment was predominantly bullish with the major indexes scoring another winning session supported by a couple of billion-dollar mergers. At the same time, optimism reigned supreme that a solution will be found to bring the trade-tug-of-war between the US and China to a mutually acceptable conclusion.
As the WSJ reported Friday, negotiators are mapping out talks with the aim to have a resolution in place by November. If this comes to pass, a lot of market uncertainty would be removed, which would increase the odds of renewed strength in the equity markets. On the other hand, Trump just announced that he “does not anticipate much progress from the trade talks” and “there was not timeframe” for ending the dispute.
Right now, however, the reality looks quite different in that 25% tariffs on $16 billion of Chinese imports will be implemented later this week. That for sure will provoke a retaliatory move from China.
Outside the US, the events in Turkey continue to be troubling, as the lira and the stock market have been hammered and high inflation, political instability and debt, along with potential contagion, remain a constant focal point for global investors.
Bond bears were the ones that suffered some losses today, as yields weakened, and bonds rallied. The 10-year lost 5 basis points to close at 2.82%, its lowest since the end of May. It’s not clear yet if that was the result of reports announcing that Trump accused the Fed of not being dovish enough.
On deck for this Wednesday is the release of the minutes from the Fed’s most recent meeting. Every word will be scrutinized to gain insight into the path of intended interest rate policy over the remainder of the year.
- ETFs in the Spotlight
In case you missed the announcement and description of this section, you can read it here again.
It features 10 broadly diversified and sector ETFs from my HighVolume list as posted every Saturday. Furthermore, they are screened for the lowest MaxDD% number meaning they have been showing better resistance to temporary sell offs than all others over the past year.
The below table simply demonstrates the magnitude with which some of the ETFs are fluctuating regarding their positions above or below their respective individual trend lines (%M/A). A break below, represented by a negative number, shows weakness, while a break above, represented by a positive percentage, shows strength.
For hundreds of ETF choices, be sure to reference Thursday’s StatSheet.
Year to date, here’s how our candidates have fared so far:
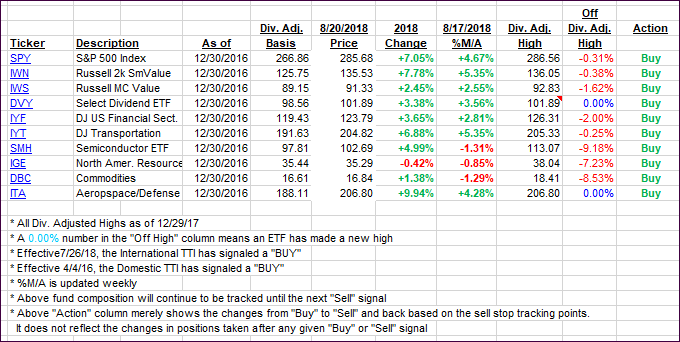
Again, the %M/A column above shows the position of the various ETFs in relation to their respective long-term trend lines, while the trailing sell stops are being tracked in the “Off High” column. The “Action” column will signal a “Sell” once the -8% point has been taken out in the “Off High” column. For more volatile sector ETFs, the trigger point is -10%.
- Trend Tracking Indexes (TTIs)
Our Trend Tracking Indexes (TTIs) both headed north with the International one showing far more strength by homing in on its trend line at a rapid rate. While we’re still below it, we have not really seen any follow through to the downside, which is why we are holding on to our bullish position for the time being.
Here’s how we closed 08/20/2018:
Domestic TTI: +2.66% above its M/A (last close +2.54%)—Buy signal effective 4/4/2016
International TTI: -0.84% below its M/A (last close -1.38%)—Buy signal effective 7/26/2018
Disclosure: I am obliged to inform you that I, as well as my advisory clients, own some of the ETFs listed in the above table. Furthermore, they do not represent a specific investment recommendation for you, they merely show which ETFs from the universe I track are falling within the guidelines specified.
Contact Ulli