
- Moving the markets
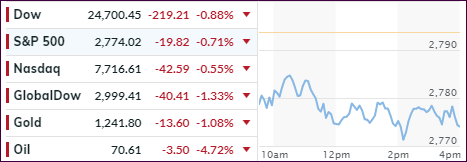
The 4-day winning streak for US equities came to a sudden halt this morning with the major indexes taking a steep dive, as trade-war jitters returned to front-and-center with Trump announcing new tariffs on Chinese goods. After days of calm, which allowed the stock markets to make a nice run, reality set in with fears mounting that a full-on trade war might be a distinct possibility.
The latest was an announcement by the White House that it is examining slapping 10% tariffs on another $200 billion of Chinese goods, which sends a clear message that the US is willing to take the dispute to the next level. Given the ever-increasing level of hostility, it’s hard to make a case how a full-blown trade war can be avoided and with it the economic consequences.
There was no place to hide, as red numbers dominated throughout most parts of the world. Looking at my favorite chart again, it seems that stocks will have a long way to go to catch down to the reality of the bond markets. The odd man out was the US Dollar, which spiked to levels last seen on the 4th of July.
Commodities were hammered and crashed the most in 4 years to a new record low, in part caused by the CME having difficulties with their data streams. Copper got clubbed like a baby seal while Crude Oil simply collapsed.
Our International TTI, which had just climbed back above its trend line 2 days ago, succumbed to selling pressure and slipped back below it, which confirms our current “Sell” signal to be out of that market.
It remains to be seen whether today’s activity was just an aberration or the beginning of more downside momentum to come. Either way, volatility is sure to be our constant companion.
- ETFs in the Spotlight
In case you missed the announcement and description of this section, you can read it here again.
It features 10 broadly diversified and sector ETFs from my HighVolume list as posted every Saturday. Furthermore, they are screened for the lowest MaxDD% number meaning they have been showing better resistance to temporary sell offs than all others over the past year.
The below table simply demonstrates the magnitude with which some of the ETFs are fluctuating regarding their positions above or below their respective individual trend lines (%M/A). A break below, represented by a negative number, shows weakness, while a break above, represented by a positive percentage, shows strength.
For hundreds of ETF choices, be sure to reference Thursday’s StatSheet.
Year to date, here’s how our candidates have fared so far:
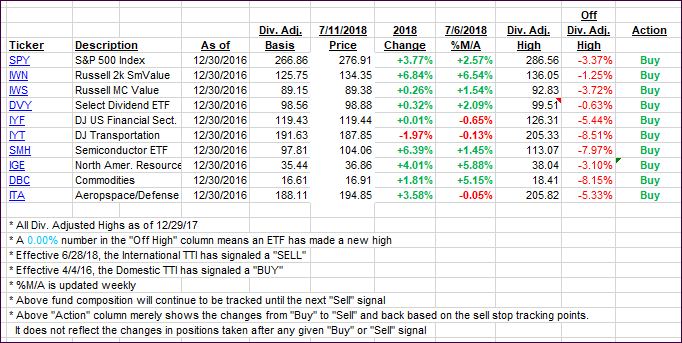
Again, the %M/A column above shows the position of the various ETFs in relation to their respective long-term trend lines, while the trailing sell stops are being tracked in the “Off High” column. The “Action” column will signal a “Sell” once the -7.5% point has been taken out in the “Off High” column.
- Trend Tracking Indexes (TTIs)
Our Trend Tracking Indexes (TTIs) reversed as red was the color of the day throughout most markets. The International TTI slipped back below its long-term trend line, after having hovered above it for 2 days, confirming our current “Sell” signal in that arena.
Here’s how we closed 07/11/2018:
Domestic TTI: +2.33% above its M/A (last close +2.56%)—Buy signal effective 4/4/2016
International TTI: -0.49% below its M/A (last close +0.58%)—Sell signal effective 6/28/2018
Disclosure: I am obliged to inform you that I, as well as my advisory clients, own some of the ETFs listed in the above table. Furthermore, they do not represent a specific investment recommendation for you, they merely show which ETFs from the universe I track are falling within the guidelines specified.
Contact Ulli