
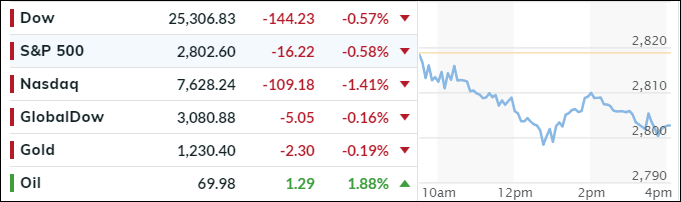
- Moving the markets
I am on the road today and tomorrow, so the market reports may be delayed…
The technology sector (QQQ) continued unraveling by not only logging a third straight session in the red but also closing at its lowest level in more than 3 weeks. It’ll be interesting to see if the 4-month long support line will hold and serve as support as it has done several times in the past.
Any break below it, however, may spell trouble for this sector and could mean much lower prices ahead. There is a clear spillover effect to the S&P 500, which is made up of some 26% technology. Or, looking at it one step further, 15.5% of the index consists of only 5 tech names. That means further down moves will certainly have a collateral effect.
All eyes are now on Apple’s earnings due out late tomorrow. Any surprise to the upside may very well have the power to pull tech out of the doldrums. It seems that Wall Street expects companies to not only to beat earnings and revenue but also present a great outlook or be punished as happened with Facebook.
In the end, it was Morgan Stanley (MS) turn to throw some words of wisdom around:
The bottom line for us is that we think the selling has just begun and this correction will be biggest since the one we experienced in February. However, it could very well have a greater negative impact on the average portfolio if it’s centered on Tech, Consumer Discretionary and small caps, as we expect.
Nobody knows for sure if this is how things will play out, but I am comfortable with the fact that we have an exit strategy in place, should MS’s ominous statement turn into reality.
- ETFs in the Spotlight
In case you missed the announcement and description of this section, you can read it here again.
It features 10 broadly diversified and sector ETFs from my HighVolume list as posted every Saturday. Furthermore, they are screened for the lowest MaxDD% number meaning they have been showing better resistance to temporary sell offs than all others over the past year.
The below table simply demonstrates the magnitude with which some of the ETFs are fluctuating regarding their positions above or below their respective individual trend lines (%M/A). A break below, represented by a negative number, shows weakness, while a break above, represented by a positive percentage, shows strength.
For hundreds of ETF choices, be sure to reference Thursday’s StatSheet.
Year to date, here’s how our candidates have fared so far:
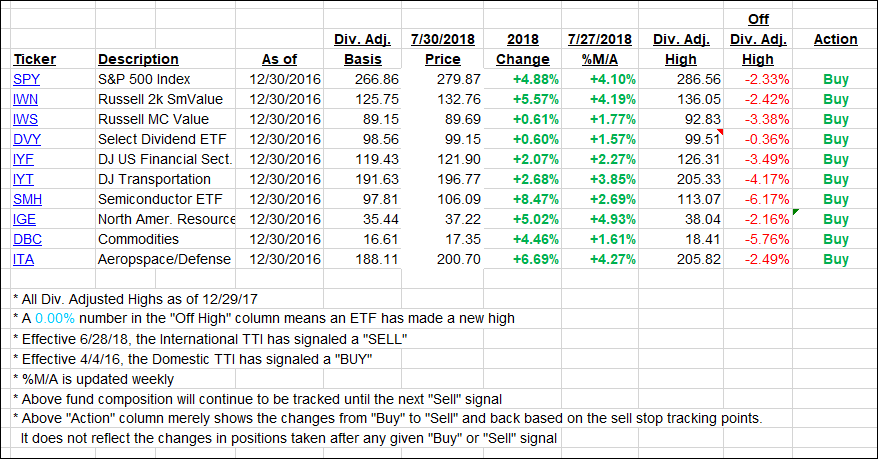
Again, the %M/A column above shows the position of the various ETFs in relation to their respective long-term trend lines, while the trailing sell stops are being tracked in the “Off High” column. The “Action” column will signal a “Sell” once the -8% point has been taken out in the “Off High” column. For more volatile sector ETFs, the trigger point is -10%.
- Trend Tracking Indexes (TTIs)
Our Trend Tracking Indexes (TTIs) headed south but remain on the bullish side of their respective trend lines.
Here’s how we closed 07/30/2018:
Domestic TTI: +1.81% above its M/A (last close +2.27%)—Buy signal effective 4/4/2016
International TTI: +0.80% above its M/A (last close +1.17%)—Buy signal effective 7/26/2018
Disclosure: I am obliged to inform you that I, as well as my advisory clients, own some of the ETFs listed in the above table. Furthermore, they do not represent a specific investment recommendation for you, they merely show which ETFs from the universe I track are falling within the guidelines specified.
Contact Ulli