
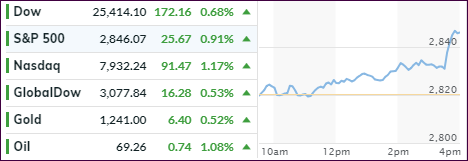
- Moving the markets
Trade tensions were on the front burner again, but this time not with China but with the EU, as President Trump and EU President Juncker met and hailed a new phase in trade relations. The White House meeting ended with the following positive joint statement:
“We agree today, first of all, to work together toward zero tariffs, zero non-tariff barriers, and zero subsidies on non-auto industrial goods.”
While negotiations will go on, the outcome was nevertheless presented as a new phase of trade relations with more eliminations of tariffs on the horizon.
Without diving into details, this announcement was all that was needed to power the markets higher with the major indexes gaining solidly as the S&P 500 approached its January highs (2,873). The advances were broad, and not isolated as we’ve seen in the recent past, pushing all of our positions to a green close.
Transportations (IYT) took top billing by sprinting ahead +2.34% followed by the Nasdaq (QQQ) with +1.40%. However, as I am writing this, there is trouble in tech land with Facebook (FB) being in the process of doing a faceplant, with its stock taking a dive (now down -23% and counting). It has officially entered bear market territory as FB’s growth rates continue to decelerate. Ouch!
This will make for an interesting market opening tomorrow with the tech sector appearing to give back possibly more than its hard-fought gains of today. It also goes to show that asset direction can turn on a dime these days, and no event in the markets can be assumed as having any permanence. To me, these are all signs of a topping formation, brought on by an aging bull market, where volatility is a constant companion caused by the latest headline hockey.
- ETFs in the Spotlight
In case you missed the announcement and description of this section, you can read it here again.
It features 10 broadly diversified and sector ETFs from my HighVolume list as posted every Saturday. Furthermore, they are screened for the lowest MaxDD% number meaning they have been showing better resistance to temporary sell offs than all others over the past year.
The below table simply demonstrates the magnitude with which some of the ETFs are fluctuating regarding their positions above or below their respective individual trend lines (%M/A). A break below, represented by a negative number, shows weakness, while a break above, represented by a positive percentage, shows strength.
For hundreds of ETF choices, be sure to reference Thursday’s StatSheet.
Year to date, here’s how our candidates have fared so far:
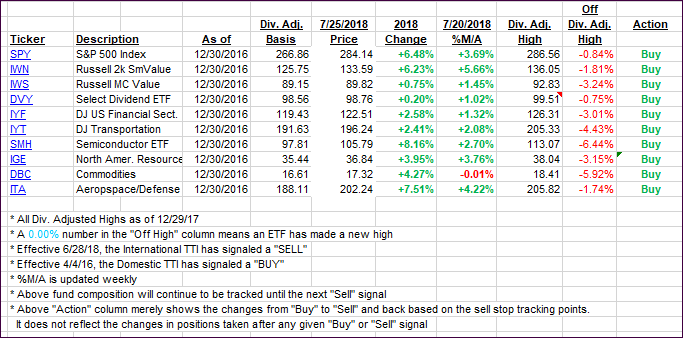
Again, the %M/A column above shows the position of the various ETFs in relation to their respective long-term trend lines, while the trailing sell stops are being tracked in the “Off High” column. The “Action” column will signal a “Sell” once the -8% point has been taken out in the “Off High” column. For more volatile sector ETFs, the trigger point is -10%.
- Trend Tracking Indexes (TTIs)
Our Trend Tracking Indexes (TTIs) jumped with the International one now having hovered above its long-term trend line for 10 days in a row. Therefore, this current short “Sell” cycle appears to be over.
As always, at these critical moments in time, I will watch the markets tomorrow and, if the trend remains up, I will take it as final confirmation that a new “Buy” cycle for “broadly diversified international equity ETFs has started.” Should the overall trend be down tomorrow, I will hold off another day before declaring the current “Sell” to be over.
Here’s how we closed 07/25/2018:
Domestic TTI: +3.17% above its M/A (last close +2.80%)—Buy signal effective 4/4/2016
International TTI: +1.62% above its M/A (last close +0.96%)—Sell signal effective 6/28/2018
Disclosure: I am obliged to inform you that I, as well as my advisory clients, own some of the ETFs listed in the above table. Furthermore, they do not represent a specific investment recommendation for you, they merely show which ETFs from the universe I track are falling within the guidelines specified.
Contact Ulli