
- Moving the markets
As I pointed out yesterday, Facebook’s (FB) horrific earnings report and news of further revenue deceleration for the second half of this year did spread to the Nasdaq, which stumbled and surrendered most of yesterday’s gains. Not only did FB end up losing $123 billion of its market cap, insider trading rumors are sure to be pursued.
The fallout from FB’s jaw dropping one-day loss goes even deeper, as the stock has been the darling of the hedge fund industry, which lost an estimated $6 billion in a matter of hours. Surely, FB will very likely not appear in their top 10 list for a while.
Quipped ZH: FB’s Zuckerberg lost $15 billion overnight. How will he get by on just $70 billion?
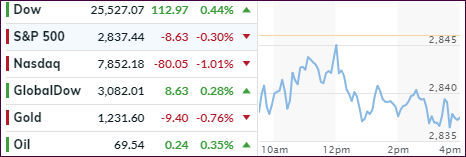
The S&P 500 followed to the downside with a modest -0.30% loss, while the Dow diverged and closed in the green as the earnings season continued in full force. Some major companies reported better-than-expected results, which may offset some of the negativity spread by FB.
While unexpected surprises, such as FB, can rock the markets, they may very well be isolated events and not reflective of overall market direction. Of course, more bad tech news (Amazon earnings are on deck), along with trade war talks, can make their presence known at any time and suddenly increase uncertainty and risk—something that we simply must live with.
If the risk gets too high in any one asset class, our trailing sell stops will point the way to the exit door to reduce exposure and therefore limit portfolio damage.
- ETFs in the Spotlight
In case you missed the announcement and description of this section, you can read it here again.
It features 10 broadly diversified and sector ETFs from my HighVolume list as posted every Saturday. Furthermore, they are screened for the lowest MaxDD% number meaning they have been showing better resistance to temporary sell offs than all others over the past year.
The below table simply demonstrates the magnitude with which some of the ETFs are fluctuating regarding their positions above or below their respective individual trend lines (%M/A). A break below, represented by a negative number, shows weakness, while a break above, represented by a positive percentage, shows strength.
For hundreds of ETF choices, be sure to reference Thursday’s StatSheet.
Year to date, here’s how our candidates have fared so far:
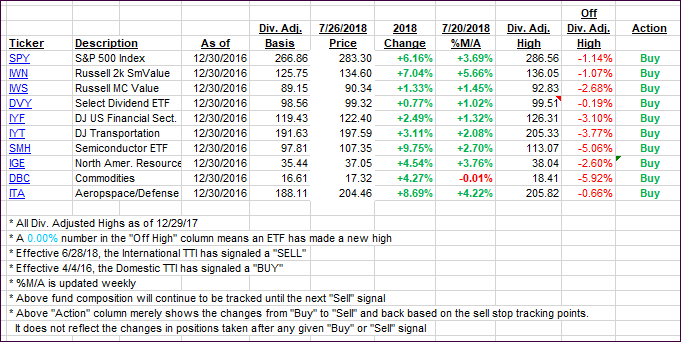
Again, the %M/A column above shows the position of the various ETFs in relation to their respective long-term trend lines, while the trailing sell stops are being tracked in the “Off High” column. The “Action” column will signal a “Sell” once the -8% point has been taken out in the “Off High” column. For more volatile sector ETFs, the trigger point is -10%.
- Trend Tracking Indexes (TTIs)
Our Trend Tracking Indexes (TTIs) slipped as markets diverged. The International one corrected but not enough to invalidate the new “Buy” signal, which was confirmed as of today.
This indicator has now stayed above its long-term trend line for 11 consecutive trading days which, of course, does not guarantee further upside moves, but it has increased the odds that it’s back in bullish mode.
Here’s how we closed 07/26/2018:
Domestic TTI: +2.82% above its M/A (last close +3.17%)—Buy signal effective 4/4/2016
International TTI: +1.44% above its M/A (last close +1.62%)—Buy signal effective 7/26/2018
Disclosure: I am obliged to inform you that I, as well as my advisory clients, own some of the ETFs listed in the above table. Furthermore, they do not represent a specific investment recommendation for you, they merely show which ETFs from the universe I track are falling within the guidelines specified.
Contact Ulli