
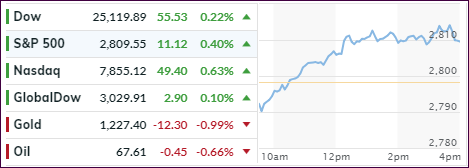
- Moving the markets
Fed chair Powell threw an assist to the markets by announcing that “the U.S. central bank wouldn’t move too quickly in changing monetary policy, and that it would be flexible in the face of changing conditions.”
He also informed the Senate Banking Committee that the “best way forward is to keep ‘gradually’ raising the federal-funds rate for now.” That was music to the ears of traders, who prefer a dovish approach to interest rate hikes as it supports equity markets, as opposed to a more aggressive (hawkish) approach, which creates bearish conditions.
Despite him throwing in the disclaimer that trade wars and fiscal policy were big unknowns, his remarks were sufficiently upbeat to pull the indexes out of an early slump and the Dow notched its 4th day of gains.
Despite Netflix disappointing, it fell -5.2%, which was well off its lows, it allowed the Nasdaq to take leadership for the day with a +0.63% gain vs. the Dow’s +0.22% and the S&P’s +0.40%.
Absent any sudden surprises, it’s now up to the earnings season to provide the ammunition needed to propel equities higher.
- ETFs in the Spotlight
In case you missed the announcement and description of this section, you can read it here again.
It features 10 broadly diversified and sector ETFs from my HighVolume list as posted every Saturday. Furthermore, they are screened for the lowest MaxDD% number meaning they have been showing better resistance to temporary sell offs than all others over the past year.
The below table simply demonstrates the magnitude with which some of the ETFs are fluctuating regarding their positions above or below their respective individual trend lines (%M/A). A break below, represented by a negative number, shows weakness, while a break above, represented by a positive percentage, shows strength.
For hundreds of ETF choices, be sure to reference Thursday’s StatSheet.
Year to date, here’s how our candidates have fared so far:
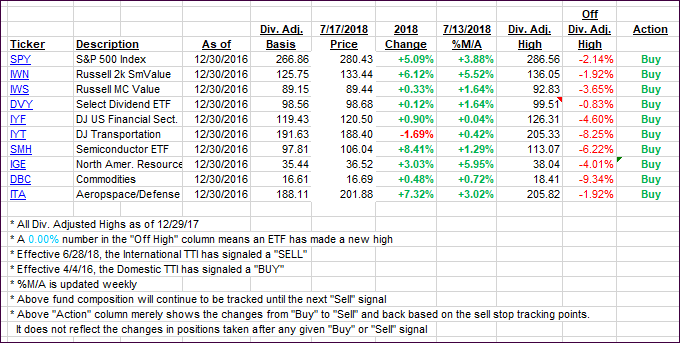
Again, the %M/A column above shows the position of the various ETFs in relation to their respective long-term trend lines, while the trailing sell stops are being tracked in the “Off High” column. The “Action” column will signal a “Sell” once the -7.5% point has been taken out in the “Off High” column.
- Trend Tracking Indexes (TTIs)
Our Trend Tracking Indexes (TTIs) both gained as upward momentum was positive. We’re still on hold with our International TTI and are waiting for more confirmation to validate a new “Buy” signal for this arena.
Here’s how we closed 07/17/2018:
Domestic TTI: +2.76% above its M/A (last close +2.57%)—Buy signal effective 4/4/2016
International TTI: +0.29% above its M/A (last close +0.14%)—Sell signal effective 6/28/2018
Disclosure: I am obliged to inform you that I, as well as my advisory clients, own some of the ETFs listed in the above table. Furthermore, they do not represent a specific investment recommendation for you, they merely show which ETFs from the universe I track are falling within the guidelines specified.
Contact Ulli