
- Moving the markets
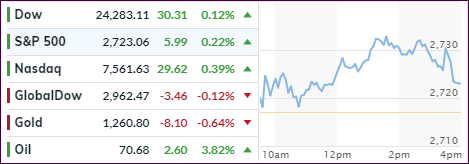
After Monday’s brutal sell-off, the major indexes managed to halt the bearish momentum by staging a modest rebound that peaked mid-day and then faded into the close. However, we ended the day with modest gains as cautious sentiment over trade policy remained on traders’ minds. To me, the session had the feel of a dead-cat bounce to it.
I consider this day an inconclusive one, as far as the status of our International TTI is concerned (see yesterday’s post). While I was looking for a sharp rebound to justify holding off with selling our international holdings, that did not materialize. On the other hand, more downside momentum would have confirmed our “Sell” signal, but that did not happen either.
In the end, I liquidated only 50% of our affected ETFs. I am now in a waiting position to see where there the markets go next. If the rebound continues, and our International TTI crosses back above its trend line, the “Sell” signal was a false one, and we will participate in the recovery with the remaining position. If, however, more downside weakness comes into play, it would confirm the “Sell,” and I will liquidate the leftover balance.
To be clear, the above only applies to “broadly diversified international ETFs.”
There was a lot of see-sawing going on in today’s session. While the major indexes stayed in the green all day, the Dow scrambled back above its 200-day M/A, only to lose it later in the day. The FANGs rebounded and so did the dollar. The odd man out was Crude Oil, which spiked and took out the $70/barrel level.
Traditionally, you could expect a quarter-ending rally for the next few days, as the window dressing factor comes into play but, with current global uncertainties, this is not a foregone conclusion.
- ETFs in the Spotlight
In case you missed the announcement and description of this section, you can read it here again.
It features 10 broadly diversified and sector ETFs from my HighVolume list as posted every Saturday. Furthermore, they are screened for the lowest MaxDD% number meaning they have been showing better resistance to temporary sell offs than all others over the past year.
The below table simply demonstrates the magnitude with which some of the ETFs are fluctuating regarding their positions above or below their respective individual trend lines (%M/A). A break below, represented by a negative number, shows weakness, while a break above, represented by a positive percentage, shows strength.
For hundreds of ETF choices, be sure to reference Thursday’s StatSheet.
Year to date, here’s how our candidates have fared so far:
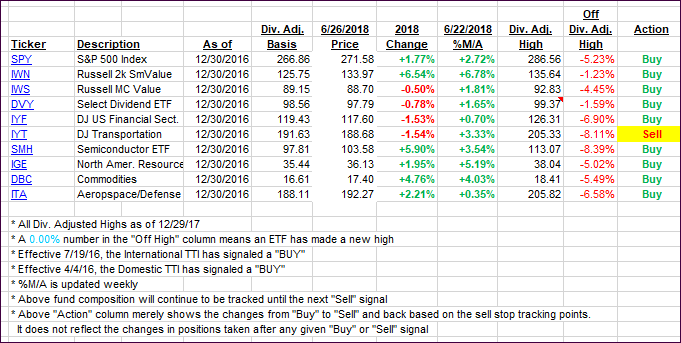
Again, the %M/A column above shows the position of the various ETFs in relation to their respective long-term trend lines, while the trailing sell stops are being tracked in the “Off High” column. The “Action” column will signal a “Sell” once the -7.5% point has been taken out in the “Off High” column.
- Trend Tracking Indexes (TTIs)
Our Trend Tracking Indexes (TTIs) were mixed with the Domestic one gaining and the International one dropping a tad.
Here’s how we closed 06/26/2018:
Domestic TTI: +1.74% above its M/A (last close +1.53%)—Buy signal effective 4/4/2016
International TTI: -1.35% below its M/A (last close -1.36%)—Buy signal effective 7/19/2016
Disclosure: I am obliged to inform you that I, as well as my advisory clients, own some of the ETFs listed in the above table. Furthermore, they do not represent a specific investment recommendation for you, they merely show which ETFs from the universe I track are falling within the guidelines specified.
Contact Ulli