
- Moving the markets
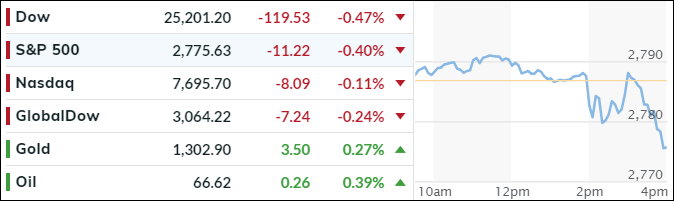
The major indexes hovered above the unchanged line for most of the session, but some volatility set in after the Fed’s (expected) announcement of a 25-bps increase in interest rates, while assuring the Wall Street crowd that the economy is not yet overheating. Yet, at the same time, Fed head Powell signaled that two more hikes would be on the table for 2018, rather than the expected hoped for one.
His exact words were “there is no sense in our forecasts that inflation will take off. If we thought inflation would take off, we would be showing higher rates.” You should feel much better now knowing that the CPI inflation you experience day-to-day, is non-existent.
In the end, equities dove into the close with the major indexes suffering mild losses. While the “most shorted stocks” were flat today, this chart demonstrates the tremendous impact of the short squeeze we’ve seen over the past few weeks.
As could be expected, bond yields rallied at first, with the 10-year yield touching the 3% level, before turning around and ending just about unchanged. The US Dollar rode his own roller coaster by heading higher at first, then dropping into the red, recovering into the green and closing below the unchanged line.
On the calendar for tomorrow is the widely anticipated ECB meeting, during which they are supposed to unveil the timing of their bond purchases. Translated, it simply means whether they will unwind at a faster or slower pace, the former of which translates to the equivalent of a tightening effect as far as monetary policy is concerned.
- ETFs in the Spotlight
In case you missed the announcement and description of this section, you can read it here again.
It features 10 broadly diversified and sector ETFs from my HighVolume list as posted every Saturday. Furthermore, they are screened for the lowest MaxDD% number meaning they have been showing better resistance to temporary sell offs than all others over the past year.
The below table simply demonstrates the magnitude with which some of the ETFs are fluctuating regarding their positions above or below their respective individual trend lines (%M/A). A break below, represented by a negative number, shows weakness, while a break above, represented by a positive percentage, shows strength.
For hundreds of ETF choices, be sure to reference Thursday’s StatSheet.
Year to date, here’s how our candidates have fared so far:
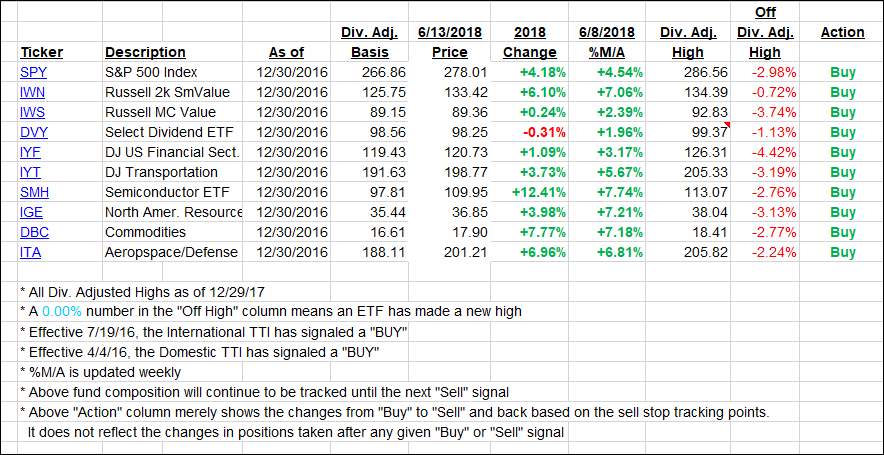
Again, the %M/A column above shows the position of the various ETFs in relation to their respective long-term trend lines, while the trailing sell stops are being tracked in the “Off High” column. The “Action” column will signal a “Sell” once the -7.5% point has been taken out in the “Off High” column.
- Trend Tracking Indexes (TTIs)
Our Trend Tracking Indexes (TTIs) changed only immaterially.
Here’s how we closed 06/13/2018:
Domestic TTI: +2.76% above its M/A (last close +2.88%)—Buy signal effective 4/4/2016
International TTI: +2.00% below its M/A (last close +2.02%)—Buy signal effective 7/19/2016
Disclosure: I am obliged to inform you that I, as well as my advisory clients, own some of the ETFs listed in the above table. Furthermore, they do not represent a specific investment recommendation for you, they merely show which ETFs from the universe I track are falling within the guidelines specified.
Contact Ulli