
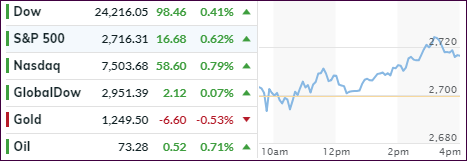
- Moving the markets
Another slow start followed by a bounce back, which had legs for a change, gave the major indexes a victory session, although a modest one. Whether this was just another dead-cat bounce remains to be seen, but bullish momentum was not overwhelming thereby confirming our Domestic “Sell” signal affecting “broadly diversified international equity ETFs.”
I sold our last holding this morning, and we will not re-enter this arena until our International TTI (section 3) crosses solidly back above its long-term trend line.
All of Europe, except for Great Britain, got spanked and deep red was the preferred color on their stock exchanges. Domestically, the Dow’s troubles with its 200-day M/A continued as it closed the 4th day below it, which is not a good sign for the bullish crowd.
Scanning across markets, we see that the dollar slipped while Bond yields rose modestly. Foreign exchange markets (FX) showed a mixed picture with the Argentine Peso collapsing to a new low, while the Mexican Peso rallied ahead of elections. Not to be outdone, the Chinese Yuan continued its swan-dive like imitation by slumping for the 11th straight day.
Regarding domestic markets, we have simply been stuck in a trading range for the first half of this year. Look at this chart of the S&P 500:
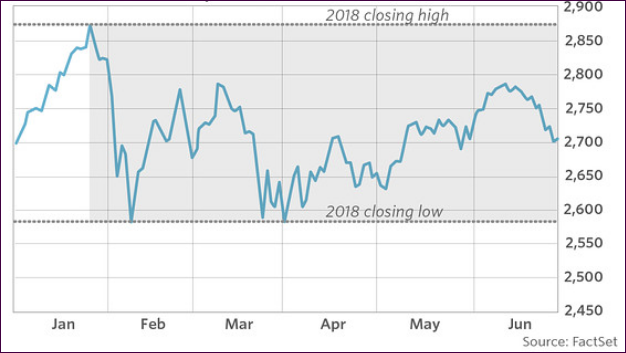
It shows the highs and the lows YTD. Right now, we’re stuck smack in the middle and will have to wait to see when the breakout occurs. It’s not question of “if” but “when” along with “which direction?”
- ETFs in the Spotlight
In case you missed the announcement and description of this section, you can read it here again.
It features 10 broadly diversified and sector ETFs from my HighVolume list as posted every Saturday. Furthermore, they are screened for the lowest MaxDD% number meaning they have been showing better resistance to temporary sell offs than all others over the past year.
The below table simply demonstrates the magnitude with which some of the ETFs are fluctuating regarding their positions above or below their respective individual trend lines (%M/A). A break below, represented by a negative number, shows weakness, while a break above, represented by a positive percentage, shows strength.
For hundreds of ETF choices, be sure to reference Thursday’s StatSheet.
Year to date, here’s how our candidates have fared so far:
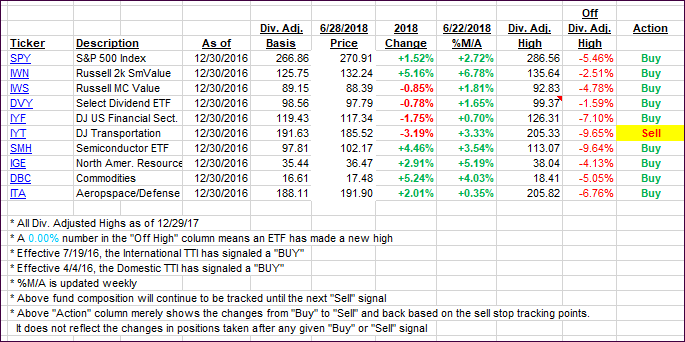
Again, the %M/A column above shows the position of the various ETFs in relation to their respective long-term trend lines, while the trailing sell stops are being tracked in the “Off High” column. The “Action” column will signal a “Sell” once the -7.5% point has been taken out in the “Off High” column.
- Trend Tracking Indexes (TTIs)
Our Trend Tracking Indexes (TTIs) recovered slightly.
Here’s how we closed 06/28/2018:
Domestic TTI: +1.55% above its M/A (last close +1.28%)—Buy signal effective 4/4/2016
International TTI: -1.83% below its M/A (last close -2.07%)—Sell signal effective 6/28/2018
Disclosure: I am obliged to inform you that I, as well as my advisory clients, own some of the ETFs listed in the above table. Furthermore, they do not represent a specific investment recommendation for you, they merely show which ETFs from the universe I track are falling within the guidelines specified.
Contact Ulli