
- Moving the markets
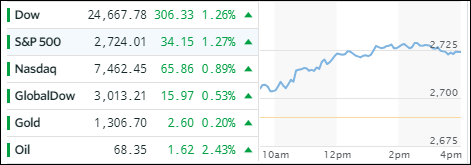
The Italian bond panic subsided somewhat as their 2-year yield dropped sharply from yesterday’s 5-year high of 2.84% to as low as 1.925%, which reassured wobbly markets that life still goes on as it helped a rebound in equities.
Here in the U.S. the old “bad news is good news” scenario emerged with a vengeance pulling the major indexes out of the doldrums and providing the spark to switch back to the bullish meme.
The bad news was that Q1 GDP was revised down to 2.2% (from 2.3%) indicating that the US economy grew slightly less than expected. That, along with Italy’s constitutional crisis, however, caused the odds of the Fed hiking interest rates 3 more times this year to drop sharply to 15%, which was all that was needed to spark today’s rally.
At day’s end, Zerohedge summed up today’s activity like this: “US stocks soar…because nothing is fixed in Europe and US growth slows.”
It makes you wonder if this chart provides a glimpse of the future…
- ETFs in the Spotlight
In case you missed the announcement and description of this section, you can read it here again.
It features 10 broadly diversified and sector ETFs from my HighVolume list as posted every Saturday. Furthermore, they are screened for the lowest MaxDD% number meaning they have been showing better resistance to temporary sell offs than all others over the past year.
The below table simply demonstrates the magnitude with which some of the ETFs are fluctuating in regards to their positions above or below their respective individual trend lines (%M/A). A break below, represented by a negative number, shows weakness, while a break above, represented by a positive percentage, shows strength.
For hundreds of ETF choices, be sure to reference Thursday’s StatSheet.
Year to date, here’s how our candidates have fared so far:
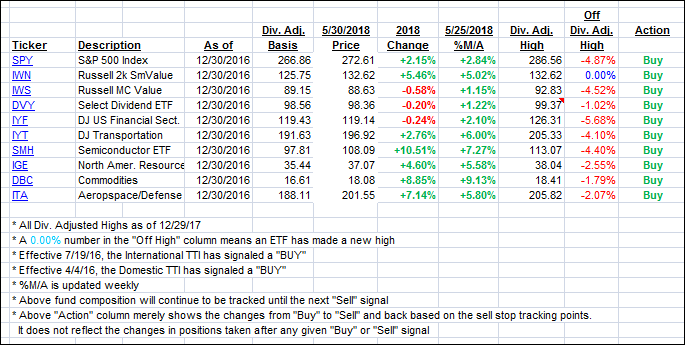
Again, the %M/A column above shows the position of the various ETFs in relation to their respective long term trend lines, while the trailing sell stops are being tracked in the “Off High” column. The “Action” column will signal a “Sell” once the -7.5% point has been taken out in the “Off High” column.
- Trend Tracking Indexes (TTIs)
Our Trend Tracking Indexes (TTIs) both rallied as the markets recovered.
Here’s how we closed 05/30/2018:
Domestic TTI: +2.06% above its M/A (last close +1.61%)—Buy signal effective 4/4/2016
International TTI: +0.84% below its M/A (last close +0.02%)—Buy signal effective 7/19/2016
Disclosure: I am obliged to inform you that I, as well as my advisory clients, own some of the ETFs listed in the above table. Furthermore, they do not represent a specific investment recommendation for you, they merely show which ETFs from the universe I track are falling within the guidelines specified.
Contact Ulli