
- Moving the markets
While worries about Italy’s politics faded for the moment, they were quickly replaced by news of a new Spanish PM, with a very critical view of the European Union, causing more uncertainties in the markets.
However, taking top billing was the Trump administration’s confirmation imposing steel and aluminum tariffs on the EU, Mexico and Canada beginning at midnight tonight. The response by the EU was quick and angry and counter balancing measures were said to be on its way.
Not helping the bearish mood were headlines that the housing rebound is slowly dying with new, existing and pending home sales tumbling in April.
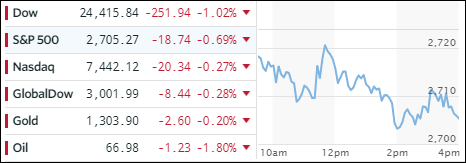
As a result, the major indexes headed south again, after an encouraging rebound yesterday, but they managed to close in the green for the month with the S&P 500 adding 2.2%.
Despite sliding bond yields, with the 10-year dropping 1 basis point to close at 2.83%, we’ve seen as of late a variety of risk scenarios that have kept a lid on market advances.
Looking back to the beginning of the year, we’ve struggled with a range of issues, namely higher interest rates and inflation, which was followed by trade/geopolitical fears and now Italian and Spanish politics.
And, let’s not forget the potential downgrade and/or possible demise of Deutsche Bank (DB), AKA the mother of all derivatives. Making its situation even more critical was today’s disclosure by the Fed that DB had been placed on a “troubled condition” status a year ago. Ouch!
It promises to be an interesting summer…
- ETFs in the Spotlight
In case you missed the announcement and description of this section, you can read it here again.
It features 10 broadly diversified and sector ETFs from my HighVolume list as posted every Saturday. Furthermore, they are screened for the lowest MaxDD% number meaning they have been showing better resistance to temporary sell offs than all others over the past year.
The below table simply demonstrates the magnitude with which some of the ETFs are fluctuating in regards to their positions above or below their respective individual trend lines (%M/A). A break below, represented by a negative number, shows weakness, while a break above, represented by a positive percentage, shows strength.
For hundreds of ETF choices, be sure to reference Thursday’s StatSheet.
Year to date, here’s how our candidates have fared so far:
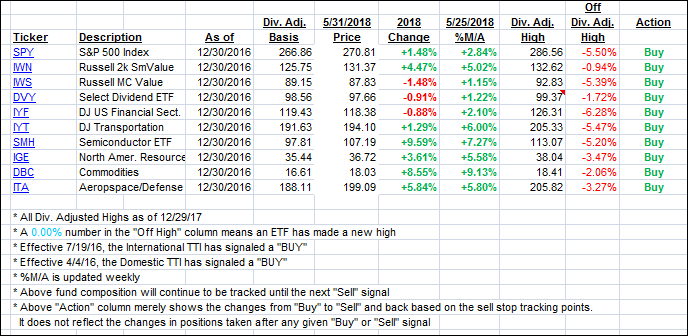
Again, the %M/A column above shows the position of the various ETFs in relation to their respective long term trend lines, while the trailing sell stops are being tracked in the “Off High” column. The “Action” column will signal a “Sell” once the -7.5% point has been taken out in the “Off High” column.
- Trend Tracking Indexes (TTIs)
Our Trend Tracking Indexes (TTIs) headed south as bad news favored the bears during this session.
Here’s how we closed 05/31/2018:
Domestic TTI: +1.81% above its M/A (last close +2.06%)—Buy signal effective 4/4/2016
International TTI: +0.46% below its M/A (last close +0.84%)—Buy signal effective 7/19/2016
Disclosure: I am obliged to inform you that I, as well as my advisory clients, own some of the ETFs listed in the above table. Furthermore, they do not represent a specific investment recommendation for you, they merely show which ETFs from the universe I track are falling within the guidelines specified.
Contact Ulli