
- Moving the markets
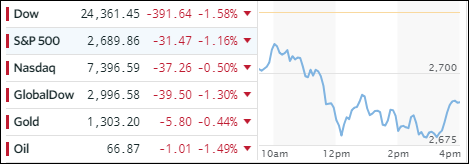
Italy’s political turmoil, along with its banking crisis, which I alluded to last Friday, continued over the weekend and into today pushing worldwide markets to the downside. The major indexes took a hit as well but recovered slightly late in the session, which some observers thought to be an appearance by the Plunge Protection Team to limit the damage.
As always, ZeroHedge succinctly summarized the meltdown best:
- Italian 2Y Yield biggest spike ever
- Italian risk curve inverted
- Italian ‘redenomination risk’ record high
- Spanish 2Y bond yields spike to 2Y highs
- Spanish ‘redenomination risk’ record high
- EU banks crash 11% in last 4 days to 18-month lows
- US banks plunge 4% to 6-month lows
- VIX back above 200DMA
- US 5Y Treasury yields plunges over 18bps – most since March 2009
- US 30Y Yield back below 3.00% – lowest in 7 weeks
- Dollar Index spiked to 6-month highs
While Italy may face fresh elections later on this year, Spanish markets were hit as well with the parliament starting the process for a no confidence vote against PM Rajoy creating a sea of red numbers in exchanges around the world.
Then Deutsche Bank (DB), long caught in a downside spiral, and facing a possible S&P downgrade, saw its stock price sink another -6.22% to $11.30 and within striking distance to the red line in the sand, namely the $10 level. Remember, with DB’s large exposure to Italian bonds, and being the world’s largest holder of derivatives, a potential demise would have a domino effect around the world.
Benefiting from all this panic around the world were Treasury Bonds, which rallied sharply with their yields dropping some 13-18 basis points, as the hunt for perceived safety continued. The 10-year yield closed down 16 basis points to end at 2.77%, far away from the danger zone known as the 3% level.
Also gaining from this turmoil was the US dollar (UUP), which closed up 0.69% to make new 6 month highs. If these events prove to be contagious, and further affect equities, we may be heading for the safety of the sideline in the near future, but the jury still out. At the same time, these uncertainties may make the Fed’s next planned 3 rate hikes obsolete.
- ETFs in the Spotlight
In case you missed the announcement and description of this section, you can read it here again.
It features 10 broadly diversified and sector ETFs from my HighVolume list as posted every Saturday. Furthermore, they are screened for the lowest MaxDD% number meaning they have been showing better resistance to temporary sell offs than all others over the past year.
The below table simply demonstrates the magnitude with which some of the ETFs are fluctuating in regards to their positions above or below their respective individual trend lines (%M/A). A break below, represented by a negative number, shows weakness, while a break above, represented by a positive percentage, shows strength.
For hundreds of ETF choices, be sure to reference Thursday’s StatSheet.
Year to date, here’s how our candidates have fared so far:
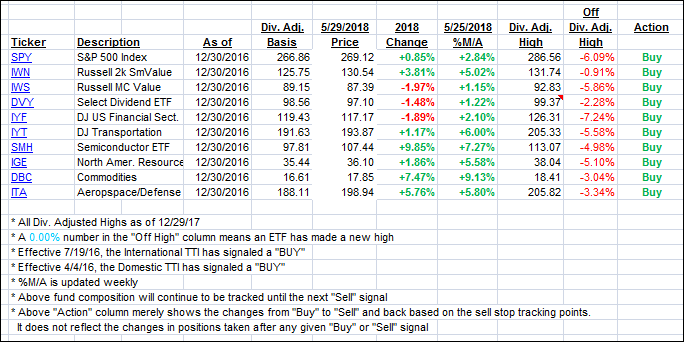
Again, the %M/A column above shows the position of the various ETFs in relation to their respective long term trend lines, while the trailing sell stops are being tracked in the “Off High” column. The “Action” column will signal a “Sell” once the -7.5% point has been taken out in the “Off High” column.
- Trend Tracking Indexes (TTIs)
Our Trend Tracking Indexes (TTIs) were mixed with the Domestic one holding up far better than the International one, which took a steep dive and stopped barely above its trend line.
Here’s how we closed 05/29/2018:
Domestic TTI: +1.61% above its M/A (last close +1.85%)—Buy signal effective 4/4/2016
International TTI: +0.02% below its M/A (last close +1.48%)—Buy signal effective 7/19/2016
Disclosure: I am obliged to inform you that I, as well as my advisory clients, own some of the ETFs listed in the above table. Furthermore, they do not represent a specific investment recommendation for you, they merely show which ETFs from the universe I track are falling within the guidelines specified.
Contact Ulli