
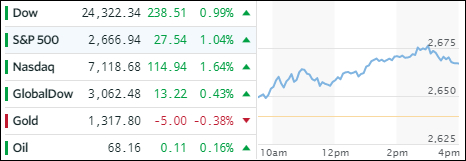
- Moving the markets
The tech sector took the lead during today’s rally, powered by FB’s strong results, which helped their shares to a solid +9.06% gain. While technology was the biggest gainer, 9 of the 11 primary S&P sectors finished higher. The loser of the day was telecommunications with -3.2%, which suffered due to AT&Ts poor results.
Interest rate concerns were pushed to the back burner as the 10-year bond yield slipped today and moved below its widely watched 3% level restoring a bit of calmness in the markets—at least for the time being. This benefited our Trend Tracking Indexes (TTI), which increased their safety margins to their M/As, meaning that a potential “Sell” signal is not imminent based on current numbers (see section 3 below).
While the tech sector appears to have found some footing, after it became clear that FB’s debacle of the last 45 days apparently did not affect their growth and user adoption, we might see some more upside over the next couple of days. That is until Apple Computers presents its report card on May 1. If their earnings are less than expected, thereby confirming recent stories about a reduction in demand, the tech euphoria might fade quickly.
- ETFs in the Spotlight
In case you missed the announcement and description of this section, you can read it here again.
It features 10 broadly diversified and sector ETFs from my HighVolume list as posted every Saturday. Furthermore, they are screened for the lowest MaxDD% number meaning they have been showing better resistance to temporary sell offs than all others over the past year.
The below table simply demonstrates the magnitude with which some of the ETFs are fluctuating in regards to their positions above or below their respective individual trend lines (%M/A). A break below, represented by a negative number, shows weakness, while a break above, represented by a positive percentage, shows strength.
For hundreds of ETF choices, be sure to reference Thursday’s StatSheet.
Year to date, here’s how our candidates have fared so far:
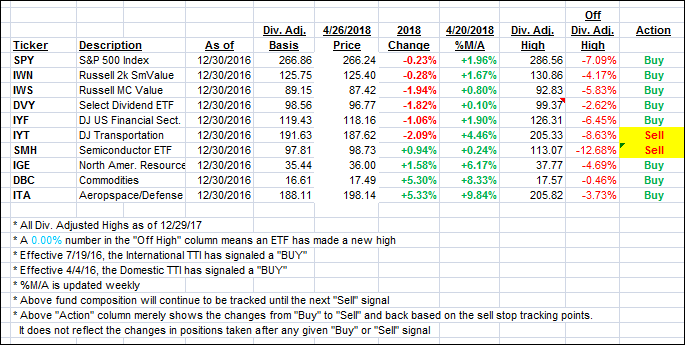
Again, the %M/A column above shows the position of the various ETFs in relation to their respective long term trend lines, while the trailing sell stops are being tracked in the “Off High” column. The “Action” column will signal a “Sell” once the -7.5% point has been taken out in the “Off High” column.
- Trend Tracking Indexes (TTIs)
Our Trend Tracking Indexes (TTIs) jumped as bullish momentum prevailed.
Here’s how we closed 4/26/2018:
Domestic TTI: +1.15% above its M/A (last close +0.62%)—Buy signal effective 4/4/2016
International TTI: +1.70% below its M/A (last close +1.18%)—Buy signal effective 7/19/2016
Disclosure: I am obliged to inform you that I, as well as my advisory clients, own some of the ETFs listed in the above table. Furthermore, they do not represent a specific investment recommendation for you, they merely show which ETFs from the universe I track are falling within the guidelines specified.
Contact Ulli