
- Moving the markets
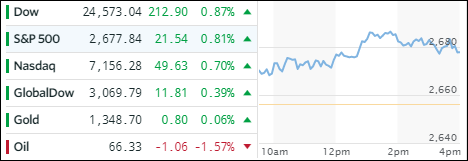
By the time the opening bell rang this morning, the lobbing of a bunch of missiles into useless Syrian targets on Friday had been long forgotten with the focus now having shifted to the upcoming earnings season.
Everything appeared to be positive for the market with the S&P 500 honing in on its 50-day M/A, below which it has been stuck since March 9th. All of the 11 S&P sectors closed in the green. While BofAs earnings results exceeded expectations, the stock rose only +0.44%.
Interest rates showed a mixed picture with the 10-year bond yield coming down by 1 basis point to end the day at 2.83%. The US Dollar (UUP) gave back -0.34% and dipped below its 50-day M/A confirming bearish momentum.
With the Syrian debacle having died down, hopefully for good, and earnings season on deck, with great expectations, we should be able to break out of the current congestive sideways pattern and resume a more consistent upward trend. Only time will tell.
- ETFs in the Spotlight
In case you missed the announcement and description of this section, you can read it here again.
It features 10 broadly diversified and sector ETFs from my HighVolume list as posted every Saturday. Furthermore, they are screened for the lowest MaxDD% number meaning they have been showing better resistance to temporary sell offs than all others over the past year.
The below table simply demonstrates the magnitude with which some of the ETFs are fluctuating in regards to their positions above or below their respective individual trend lines (%M/A). A break below, represented by a negative number, shows weakness, while a break above, represented by a positive percentage, shows strength.
For hundreds of ETF choices, be sure to reference Thursday’s StatSheet.
Year to date, here’s how our candidates have fared so far:
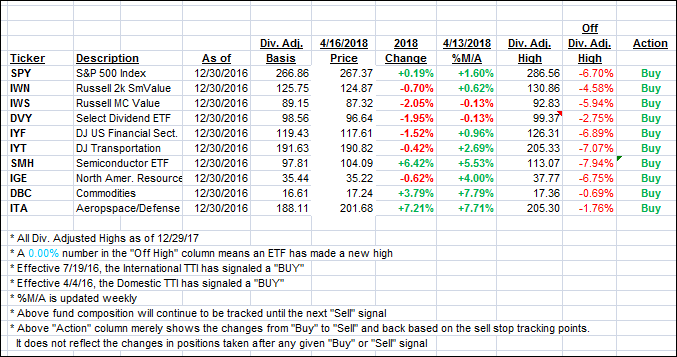
Again, the %M/A column above shows the position of the various ETFs in relation to their respective long term trend lines, while the trailing sell stops are being tracked in the “Off High” column. The “Action” column will signal a “Sell” once the -7.5% point has been taken out in the “Off High” column.
- Trend Tracking Indexes (TTIs)
Our Trend Tracking Indexes (TTIs) rebounded as the bulls ruled the session.
Here’s how we closed 4/16/2018:
Domestic TTI: +1.51% above its M/A (last close +1.20%)—Buy signal effective 4/4/2016
International TTI: +2.05% below its M/A (last close +1.87%)—Buy signal effective 7/19/2016
Disclosure: I am obliged to inform you that I, as well as my advisory clients, own some of the ETFs listed in the above table. Furthermore, they do not represent a specific investment recommendation for you, they merely show which ETFs from the universe I track are falling within the guidelines specified.
Contact Ulli