
- Moving the markets
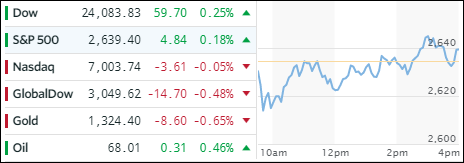
While rising bond yields continued to wreak havoc with the markets early on, a slow but steady climb, supported by strong corporate earnings and dip-buyers, proved to be saviors for the session by pushing the Dow and S&P 500 into the green by a small margin. The Nasdaq ended slightly lower, which was its 5th straight close to the downside, its longest in over a year.
Rising interest rates remain at the core of the problem for stocks with the 10-year bond yield now passing the 3% marker to reach a point last seen in December 2013. Again, if yields rise because of stronger economic growth that is not as worrisome as when they rise due to stronger inflation, which is the scenario we are in.
So far, the earnings season has been one with mixed results. More than 80% of the S&P companies who have reported have beaten forecasts. However, those results have not inspired enough confidence in Wall Street traders to go on a buying spree and push equities higher as general nervousness about the markets has prevailed.
Thanks to the rebound, our directional indicators, the Trend Tracking Indexes (TTIs), were not affected, and we remain in “Buy” mode—that is for the time being.
- ETFs in the Spotlight
In case you missed the announcement and description of this section, you can read it here again.
It features 10 broadly diversified and sector ETFs from my HighVolume list as posted every Saturday. Furthermore, they are screened for the lowest MaxDD% number meaning they have been showing better resistance to temporary sell offs than all others over the past year.
The below table simply demonstrates the magnitude with which some of the ETFs are fluctuating in regards to their positions above or below their respective individual trend lines (%M/A). A break below, represented by a negative number, shows weakness, while a break above, represented by a positive percentage, shows strength.
For hundreds of ETF choices, be sure to reference Thursday’s StatSheet.
Year to date, here’s how our candidates have fared so far:
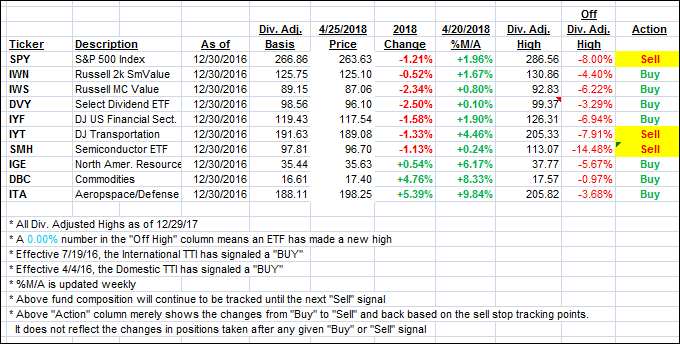
Again, the %M/A column above shows the position of the various ETFs in relation to their respective long term trend lines, while the trailing sell stops are being tracked in the “Off High” column. The “Action” column will signal a “Sell” once the -7.5% point has been taken out in the “Off High” column.
- Trend Tracking Indexes (TTIs)
Our Trend Tracking Indexes (TTIs) closed mixed as a late day rally offset an early drop.
Here’s how we closed 4/25/2018:
Domestic TTI: +0.62% above its M/A (last close +0.59%)—Buy signal effective 4/4/2016
International TTI: +1.18% below its M/A (last close +1.35%)—Buy signal effective 7/19/2016
Disclosure: I am obliged to inform you that I, as well as my advisory clients, own some of the ETFs listed in the above table. Furthermore, they do not represent a specific investment recommendation for you, they merely show which ETFs from the universe I track are falling within the guidelines specified.
Contact Ulli