
ETF Tracker StatSheet
ENDING THE WEEK WITH A WHIMPER
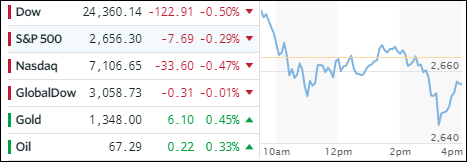
- Moving the markets
The major indexes came under pressure and surrendered early gains as initial reads on the upcoming earnings season disappointed. Expectations have been high about corporate performance maybe in part due to the fact that geopolitical anxieties have painted a distorted picture.
While three major banks showed some better than anticipated report cards today, equities headed south anyway and pushed the financial sector down (XLF -1.51%). Still for the week, the Dow gained 2% while the S&P 500 and Nasdaq added 2.1% and 3% respectively.
Headline news ping-pong was in full swing today including such topics as China trade wars, Comey, Rosenstein, Mueller, Syria, Russia and slumping consumer sentiment, which were all adding to the general confusion in the market place rather than providing much needed clarity.
But, these are the roller-coaster times we live in, so we will continue to focus on the only reality we have, which is the major direction of the markets via our Trend Tracking Indexes (TTIs). The trend remains bullish, and we will stay on board until the bears gain the upper hand.
- ETFs in the Spotlight
In case you missed the announcement and description of this section, you can read it here again.
It features 10 broadly diversified and sector ETFs from my HighVolume list as posted every Saturday. Furthermore, they are screened for the lowest MaxDD% number meaning they have been showing better resistance to temporary sell offs than all others over the past year.
The below table simply demonstrates the magnitude with which some of the ETFs are fluctuating in regards to their positions above or below their respective individual trend lines (%M/A). A break below, represented by a negative number, shows weakness, while a break above, represented by a positive percentage, shows strength.
For hundreds of ETF choices, be sure to reference Thursday’s StatSheet.
Year to date, here’s how our candidates have fared so far:
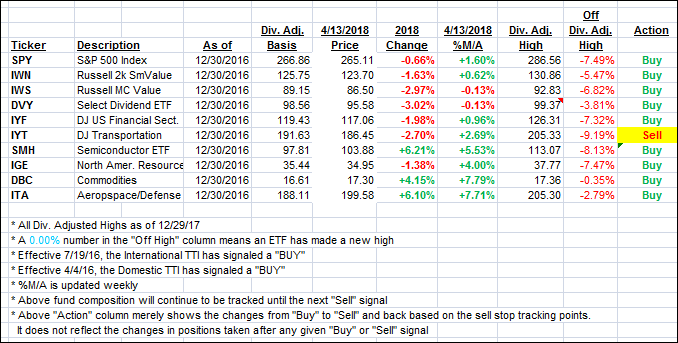
Again, the %M/A column above shows the position of the various ETFs in relation to their respective long term trend lines, while the trailing sell stops are being tracked in the “Off High” column. The “Action” column will signal a “Sell” once the -7.5% point has been taken out in the “Off High” column.
- Trend Tracking Indexes (TTIs)
Our Trend Tracking Indexes (TTIs) slipped as weakness prevailed during today’s session.
Here’s how we closed 4/13/2018:
Domestic TTI: +1.20% above its M/A (last close +1.48%)—Buy signal effective 4/4/2016
International TTI: +1.87% below its M/A (last close +2.11%)—Buy signal effective 7/19/2016
Disclosure: I am obliged to inform you that I, as well as my advisory clients, own some of the ETFs listed in the above table. Furthermore, they do not represent a specific investment recommendation for you, they merely show which ETFs from the universe I track are falling within the guidelines specified.
————————————————————-
READER Q & As
All Reader Q & A’s are listed at our web site!
Check it out at:
https://theetfbully.com/questions-answers/
———————————————————-
WOULD YOU LIKE TO HAVE YOUR INVESTMENTS PROFESSIONALLY MANAGED?
Do you have the time to follow our investment plans yourself? If you are a busy professional who would like to have his portfolio managed using our methodology, please contact me directly or get more details at:
https://theetfbully.com/personal-investment-management/
———————————————————
Back issues of the ETF/No Load Fund Tracker are available on the web at:
https://theetfbully.com/newsletter-archives/
Contact Ulli