
- Moving the markets
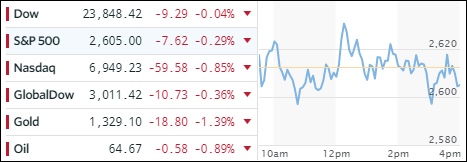
Choppy and sloppy best describes today’s session, as the major indexes vacillated around their respective unchanged lines with the Nasdaq showing the most weakness as tech shares continued their swoon. It was a tug-of-war between good economic growth data along with home sales on one side and the bearish forces still in play from the beaten up tech complex on the other side. In the end, the sagging tech sector won but only by a small margin.
One thing that seems to be sorely missing from the current market activity is the buy-the-dip phenomenon that we’ve been almost taken for granted over the past year. All of a sudden, sharp market corrections without much subsequent lasting buying have occurred. While last Friday’s market dump saw a recovery on Monday, it was short-lived, which almost puts us back to Friday’s level. It will be interesting to see of the widely watched S&P’s 200-day M/A will hold for the third time, come next week. Any break below will surely invite more selling.
We may very well be close to an inflection point where the major trend could reverse and send us back into the bearish camp. Our Trend Tracking Indexes (TTIs) are both within striking distance of crossing below their long-term trend lines and confirm this viewpoint (see section 3 below).
With one more trading session to go in this Holiday shortened week, it remains to be seen if the bulls can gain the upper hand and recuperate some of March’s losses.
- ETFs in the Spotlight
In case you missed the announcement and description of this section, you can read it here again.
It features 10 broadly diversified and sector ETFs from my HighVolume list as posted every Saturday. Furthermore, they are screened for the lowest MaxDD% number meaning they have been showing better resistance to temporary sell offs than all others over the past year.
The below table simply demonstrates the magnitude with which some of the ETFs are fluctuating in regards to their positions above or below their respective individual trend lines (%M/A). A break below, represented by a negative number, shows weakness, while a break above, represented by a positive percentage, shows strength.
For hundreds of ETF choices, be sure to reference Thursday’s StatSheet.
Year to date, here’s how our candidates have fared so far:
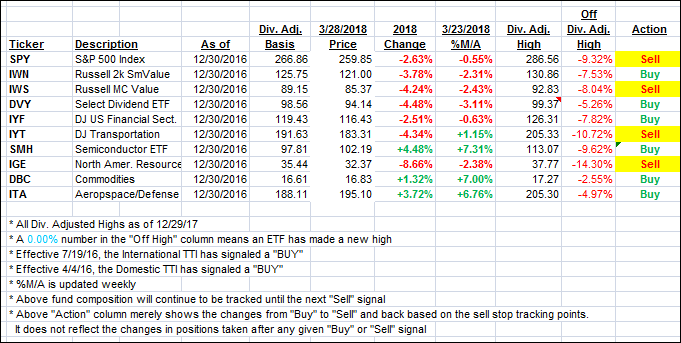
Again, the %M/A column above shows the position of the various ETFs in relation to their respective long term trend lines, while the trailing sell stops are being tracked in the “Off High” column. The “Action” column will signal a “Sell” once the -7.5% point has been taken out in the “Off High” column.
- Trend Tracking Indexes (TTIs)
Our Trend Tracking Indexes (TTIs) were mixed as the major indexes headed south again.
Here’s how we closed 3/28/2018:
Domestic TTI: +0.97% above its M/A (last close +1.10%)—Buy signal effective 4/4/2016
International TTI: +0.33% above its M/A (last close +0.28%)—Buy signal effective 7/19/2016
Disclosure: I am obliged to inform you that I, as well as my advisory clients, own some of the ETFs listed in the above table. Furthermore, they do not represent a specific investment recommendation for you, they merely show which ETFs from the universe I track are falling within the guidelines specified.
Contact Ulli