
ETF Tracker StatSheet
DOWNSIDE MOMENTUM ACCELERATES
- Moving the markets
For a while it looked like the major indexes were able to stage a modest rebound by trending slightly below and above their unchanged lines. However, that dream was short-lived as downward momentum suddenly accelerated and equities ended up diving into the close to finish an ugly week not just for domestic but global markets as well as US, European and Asian stocks all tumbled sharply in unison.
ZeroHedge summed up the carnage like this:
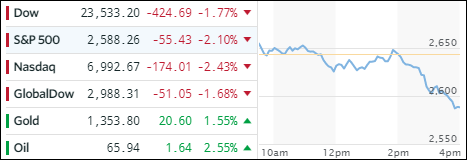
- *Dow average falls 426 points to lowest since nov. 22
- *S&P 500 sinks 5.9% in week, biggest drop in more than two years
- *Nasdaq 100 plunges 7.3% in week, most since august 2015
Technical damage was done, and especially the S&P 500 is now within striking distance of breaking below its widley watched 200-day M/A (+0.12%). Any break below could accelerate downward momentum further.
However, last time we got this close was on February 8, when it appeared that a return to bear market territoy was imminent, but we ended up bouncing off the 200-day M/A and back into bullish mode. Whether this will happen again is anyone’s guess, but the likelyhood of a bearish outcome has now increased not just due to chart patterns but also to an overall gloomy global market picture.
Today’s action sent our Trend Tracking Indexes (TTIs) much lower (see section 3), and we have a split picture. While the Domestic one remains in bullish territory by +0.83%, the International one has breached its long-term trend line to the downside by -0.45%, which means a “Sell” signal for this arena has been generated and all broadly diversified international ETFs should be sold.
They way I do this in my advisor practice is that I will first observe the markets on Monday morning to see if a rebound is in the making. If there is, I will hold off with my liquidation plans. If the markets, however, show continued weakness, I will follow through and sell those ETFs that are affected.
Continued weakness will also tell me that the likelyhood has increased that the Domestic ETFs are likely to follow to the downside. Historically, my indicators have shown that the International one tends to be the “canary in the coalmine’ on the upside as well as on the downside.
While anything is possible, I have learned over the past 30 years that, when following the Trend Tracking signals, you have to follow each one of them. Why? Because you never know if the next “Sell” signal is the one that helps you avoid the “big drop.” After all, attempting not to participate in epic potential bear markets is why we follow this methodology in the first place.
- ETFs in the Spotlight
In case you missed the announcement and description of this section, you can read it here again.
It features 10 broadly diversified and sector ETFs from my HighVolume list as posted every Saturday. Furthermore, they are screened for the lowest MaxDD% number meaning they have been showing better resistance to temporary sell offs than all others over the past year.
The below table simply demonstrates the magnitude with which some of the ETFs are fluctuating in regards to their positions above or below their respective individual trend lines (%M/A). A break below, represented by a negative number, shows weakness, while a break above, represented by a positive percentage, shows strength.
For hundreds of ETF choices, be sure to reference Thursday’s StatSheet.
Year to date, here’s how our candidates have fared so far:
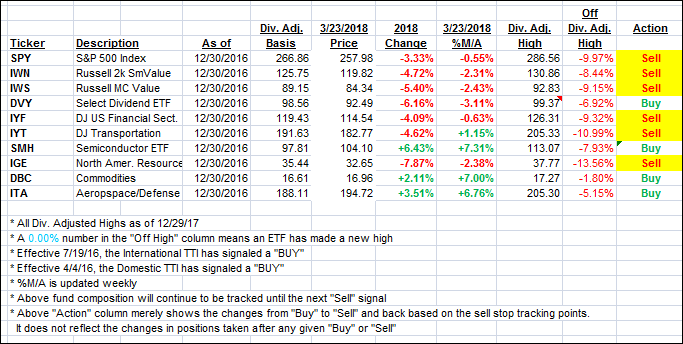
Again, the %M/A column above shows the position of the various ETFs in relation to their respective long term trend lines, while the trailing sell stops are being tracked in the “Off High” column. The “Action” column will signal a “Sell” once the -7.5% point has been taken out in the “Off High” column.
- Trend Tracking Indexes (TTIs)
Our Trend Tracking Indexes (TTIs) joined the markets and headed sharply south with especially the International one taking a steep dive.
Here’s how we closed 3/23/2018:
Domestic TTI: +0.83% above its M/A (last close +1.69%)—Buy signal effective 4/4/2016
International TTI: -0.45% below its M/A (last close +0.94%)—Buy signal effective 7/19/2016
Disclosure: I am obliged to inform you that I, as well as my advisory clients, own some of the ETFs listed in the above table. Furthermore, they do not represent a specific investment recommendation for you, they merely show which ETFs from the universe I track are falling within the guidelines specified.
————————————————————-
READER Q & As
All Reader Q & A’s are listed at our web site!
Check it out at:
https://theetfbully.com/questions-answers/
———————————————————-
WOULD YOU LIKE TO HAVE YOUR INVESTMENTS PROFESSIONALLY MANAGED?
Do you have the time to follow our investment plans yourself? If you are a busy professional who would like to have his portfolio managed using our methodology, please contact me directly or get more details at:
https://theetfbully.com/personal-investment-management/
———————————————————
Back issues of the ETF/No Load Fund Tracker are available on the web at:
https://theetfbully.com/newsletter-archives/
Contact Ulli