
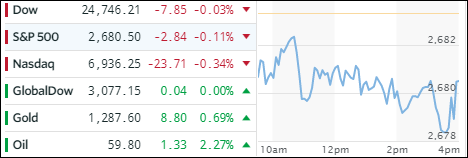
- Moving the markets
It was a tug-of-war between Apple (AAPL -2.53%) and the retail sector as the former fell and the latter rallied (XRT +1.12%). Crude oil (+2.27%) through in some bullish support but it the end, the major indexes headed south by a slight margin. Of course, Holiday shortened weeks invite low volume, so the last 4 trading days of the year may be meaningless barring any unforeseen events.
Moves in the ETFs space happened within a fairly small trading range with the exception being the tech sector, which was pulled down by Apple, causing Semiconductors (SMH) to surrender -1.13%. On the plus side, we saw small gains in MidCaps (SCHM +0.13%) and SmallCaps (SCHA +0.11%).
Interest rates were steady and therefore allowing the 20-year bond (TLT) to move up +0.30%, which was its 3rd daily gain in a row. Gold headed higher to end at $1,288 and is now reaching again for the $1,300 level. It remains to seen, whether it will get crushed again once it touches this magic glass ceiling. The US Dollar (UUP) barely moved and slipped a tiny -0.08%.
- ETFs in the Spotlight
In case you missed the announcement and description of this section, you can read it here again.
It features 10 broadly diversified and sector ETFs from my HighVolume list as posted every Saturday. Furthermore, they are screened for the lowest MaxDD% number meaning they have been showing better resistance to temporary sell offs than all others over the past year.
The below table simply demonstrates the magnitude with which some of the ETFs are fluctuating in regards to their positions above or below their respective individual trend lines (%M/A). A break below, represented by a negative number, shows weakness, while a break above, represented by a positive percentage, shows strength.
For hundreds of ETF choices, be sure to reference Thursday’s StatSheet.
Year to date, here’s how the 2017 candidates have fared so far:
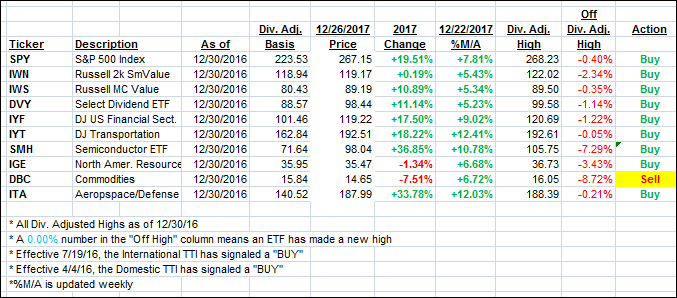 Again, the %M/A column above shows the position of the various ETFs in relation to their respective long term trend lines, while the trailing sell stops are being tracked in the “Off High” column. The “Action” column will signal a “Sell” once the -7.5% point has been taken out in the “Off High” column.
- Trend Tracking Indexes (TTIs)
Our Trend Tracking Indexes (TTIs) lost a tad as low volume indicated reduced Holiday market participation.
Here’s how we closed 12/26/2017:
Domestic TTI: +3.73% above its M/A (last close +3.79%)—Buy signal effective 4/4/2016
International TTI: +4.75% above its M/A (last close +4.77%)—Buy signal effective 7/19/2016
Disclosure: I am obliged to inform you that I, as well as my advisory clients, own some of the ETFs listed in the above table. Furthermore, they do not represent a specific investment recommendation for you, they merely show which ETFs from the universe I track are falling within the guidelines specified.
Contact Ulli