
ETF Tracker StatSheet
https://theetfbully.com/2017/12/weekly-statsheet-etf-tracker-newsletter-updated-12212017/
CRAWLING BACK TOWARDS THE UNCHANGED LINE
- Moving the markets
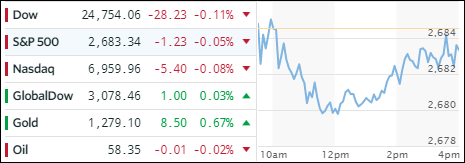
Despite today’s aimless meandering, which had the major indexes crawling out of a hole towards the unchanged line, the Dow and S&P 500 managed to score their fifth straight weekly advance despite ending the session slightly in the red. For sure, with the 3-day Holiday weekend ahead of us, there was not much motivation to push the indexes higher.
In light of the Dow’s and S&P’s strong 5-week performance, other asset classes did not fare so well. The Long bond had its worst week since the election, as interest rates rose, while the High Yield bond was down for the 4th week in a row.
Our widely held ETFs ended the day mixed. Heading higher were Emerging Markets (SCHE +0.76%), International SmallCaps (SCHC +0.50%) and Transportations (IYT +0.41%), with the laggards being Financials (XLF -0.28%) and US SmallCaps (SCHA -0.09%). Gold edged up, Crude Oil stayed about even, and the US Dollar (UUP) was range bound but gained a tiny +0.04%.
I will post the “ETFs on the Cutline” report tomorrow and will be back on Tuesday with the market commentary.
In the meantime, I wish you a Merry Christmas!
Ulli…
- ETFs in the Spotlight
In case you missed the announcement and description of this section, you can read it here again.
It features 10 broadly diversified and sector ETFs from my HighVolume list as posted every Saturday. Furthermore, they are screened for the lowest MaxDD% number meaning they have been showing better resistance to temporary sell offs than all others over the past year.
The below table simply demonstrates the magnitude with which some of the ETFs are fluctuating in regards to their positions above or below their respective individual trend lines (%M/A). A break below, represented by a negative number, shows weakness, while a break above, represented by a positive percentage, shows strength.
For hundreds of ETF choices, be sure to reference Thursday’s StatSheet.
Year to date, here’s how the 2017 candidates have fared so far:
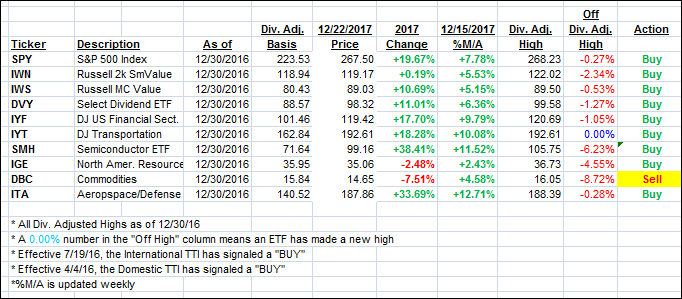
Again, the %M/A column above shows the position of the various ETFs in relation to their respective long term trend lines, while the trailing sell stops are being tracked in the “Off High” column. The “Action” column will signal a “Sell” once the -7.5% point has been taken out in the “Off High” column.
- Trend Tracking Indexes (TTIs)
Our Trend Tracking Indexes (TTIs) slipped as the major indexes lacked upward momentum.
Here’s how we closed 12/22/2017:
Domestic TTI: +3.79% above its M/A (last close +4.07%)—Buy signal effective 4/4/2016
International TTI: +4.77% above its M/A (last close +5.19%)—Buy signal effective 7/19/2016
Disclosure: I am obliged to inform you that I, as well as my advisory clients, own some of the ETFs listed in the above table. Furthermore, they do not represent a specific investment recommendation for you, they merely show which ETFs from the universe I track are falling within the guidelines specified.
————————————————————-
READER Q & A FOR THE WEEK
All Reader Q & A’s are listed at our web site!
Check it out at:
https://theetfbully.com/questions-answers/
———————————————————-
WOULD YOU LIKE TO HAVE YOUR INVESTMENTS PROFESSIONALLY MANAGED?
Do you have the time to follow our investment plans yourself? If you are a busy professional who would like to have his portfolio managed using our methodology, please contact me directly or get more details at:
https://theetfbully.com/personal-investment-management/
———————————————————
Back issues of the ETF/No Load Fund Tracker are available on the web at:
https://theetfbully.com/newsletter-archives/
Contact Ulli