
- Moving the Markets
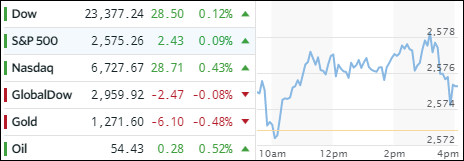
The month of October has been known as the bull market killer in the past. Not so this year, as the major indexes not only survived but prospered at the tune of +4.2%, +2.2% and +3.2% respectively for the Dow, S&P 500 and Nasdaq. The Dow actually rose at twice the pace it showed in September, while the Nasdaq remains the winner for the past 12 months. Helping matters was the VIX, which was pushed towards the 9 handle in early trading setting the bullish mood for the session.
In ETF space, we saw predominantly advances. Semiconductors (SMH) took the lead with a strong +0.96% compared to the S&P’s (SCHX) meager +0.08% advance. SmallCaps (SCHA) showed signs of life again by gaining +0.71%. Heading slightly south were Transportations (IYT) and Financials (XLF) with losses of -0.44% and -0.26% respectively.
Interest rates were mixed, but the yield on the 10-year bond managed to add 1 basis point to close at 2.38%—off its recent high of 2.46%. Consequently, the US Dollar (UUP) traded in a tight range and gained a tiny +0.08%. Gold slipped but Crude oil gained and remained above its $54 level.
- ETFs in the Spotlight (updated for 2017)
In case you missed the announcement and description of this section, you can read it here again.
It features 10 broadly diversified and sector ETFs from my HighVolume list as posted every Saturday. Furthermore, they are screened for the lowest MaxDD% number meaning they have been showing better resistance to temporary sell offs than all others over the past year.
The below table simply demonstrates the magnitude with which some of the ETFs are fluctuating in regards to their positions above or below their respective individual trend lines (%M/A). A break below, represented by a negative number, shows weakness, while a break above, represented by a positive percentage, shows strength.
For hundreds of ETF choices, be sure to reference Thursday’s StatSheet.
Year to date, here’s how the 2017 candidates have fared so far:
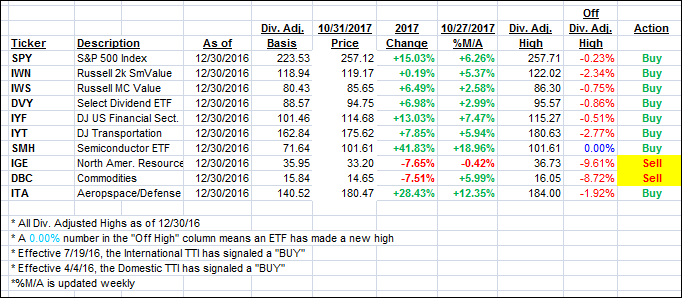
Again, the %M/A column above shows the position of the various ETFs in relation to their respective long term trend lines, while the trailing sell stops are being tracked in the “Off High” column. The “Action” column will signal a “Sell” once the -7.5% point has been taken out in the “Off High” column.
- Trend Tracking Indexes (TTIs)
Our Trend Tracking Indexes (TTIs) gained slightly with October ending on a positive note.
Here’s how we closed 10/31/2017:
Domestic TTI: +3.23% (last close +3.12%)—Buy signal effective 4/4/2016
International TTI: +6.42% (last close +6.26%)—Buy signal effective 7/19/2016
Disclosure: I am obliged to inform you that I, as well as my advisory clients, own some of the ETFs listed in the above table. Furthermore, they do not represent a specific investment recommendation for you, they merely show which ETFs from the universe I track are falling within the guidelines specified.
Contact Ulli