
- Moving the Markets
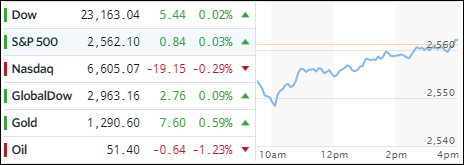
Early morning selling pressure, possibly related to the 30th anniversary of the 1987 crash, pushed the major indexes lower, with the S&P 500 being down a non-newsworthy -0.33%, before starting the long climb towards the unchanged line.
Other reports were mixed with earnings being robust while political tensions in Europe and questionable economic data out of China underpinned the early negativity. In the end, two of the three major indexes managed to close in the green with the Nasdaq trailing and closing in the red, in part due to Apple (AAPL) having a really bad day (-3.78%).
A spike in the VIX to 11 caused the markets to show the early weakness, but manipulating this index off the highs and pushing it sharply lower contributed to today’s rebound. Still, the recovery was not much to brag about, as most ETFs closed on a mixed note. On the upside, we saw Dividend ETFs (SCHD) leading with a gain of +0.23% with MidCaps (SCHM) occupying second place (+0.10%). Heading up the losers were Emerging Markets (SCHE) and International SmallCaps (SCHC), which retreated -0.83% and -0.63% respectively.
In the interest rate arena, the yield on the 10-year bond dropped 1 basis point to 2.33% helping the 20-year bond price (TLT) to squeeze out a +0.18% gain. Gold pushed towards its $1,300 level again, while oil slipped -1.23%. The US dollar (UUP) followed suit by gapping down and losing -0.25%.
- ETFs in the Spotlight (updated for 2017)
In case you missed the announcement and description of this section, you can read it here again.
It features 10 broadly diversified and sector ETFs from my HighVolume list as posted every Saturday. Furthermore, they are screened for the lowest MaxDD% number meaning they have been showing better resistance to temporary sell offs than all others over the past year.
The below table simply demonstrates the magnitude with which some of the ETFs are fluctuating in regards to their positions above or below their respective individual trend lines (%M/A). A break below, represented by a negative number, shows weakness, while a break above, represented by a positive percentage, shows strength.
For hundreds of ETF choices, be sure to reference Thursday’s StatSheet.
Year to date, here’s how the 2017 candidates have fared so far:
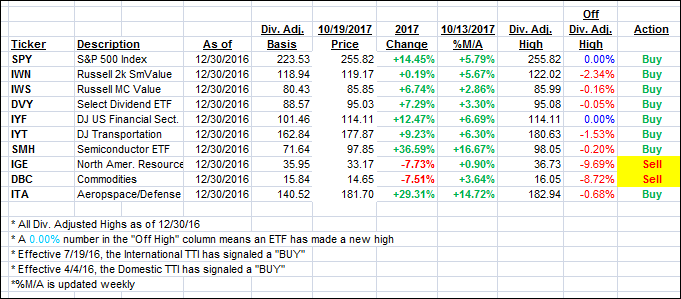
Again, the %M/A column above shows the position of the various ETFs in relation to their respective long term trend lines, while the trailing sell stops are being tracked in the “Off High” column. The “Action” column will signal a “Sell” once the -7.5% point has been taken out in the “Off High” column.
- Trend Tracking Indexes (TTIs)
Our Trend Tracking Indexes (TTIs) moved only immaterially.
Here’s how we closed 10/19/2017:
Domestic TTI: +3.11% (last close +3.19%)—Buy signal effective 4/4/2016
International TTI: +6.89% (last close +7.03%)—Buy signal effective 7/19/2016
Disclosure: I am obliged to inform you that I, as well as my advisory clients, own some of the ETFs listed in the above table. Furthermore, they do not represent a specific investment recommendation for you, they merely show which ETFs from the universe I track are falling within the guidelines specified.
Contact Ulli