
- Moving the Markets
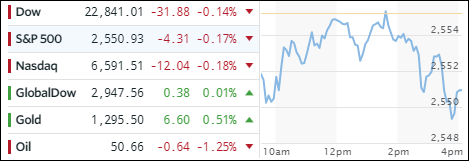
The major indexes, as well as equities in general, struggled through the session looking for some footing to use as a launching pad for the usual mid-day rebound. It worked for a while, as the unchanged line was conquered but upward momentum faded, and we closed in the red, although only fractionally. Earnings season got underway with the first batch of the banking sector reporting. Things were mixed so far, and the Financial sector ETF (XLF) dipped -0.76%.
The Transportation ETF (IYT) moved solidly higher with a gain of +0.67%. Second place went to the Dividend ETF (SCHD) with +0.13% followed by MidCaps (SCHM) with a meager +0.08%. The downside came into play today, but the losses were tiny. Semiconductors (SMH) gave back -0.21% while LargeCaps (SCHX) surrendered -0.15%. All in all, it appeared to be a market in waiting looking for a reason to bounce higher.
Treasury yields retreated again with the 10-year giving back 2 basis points. This helped the 20-year bond (TLT), which rallied +0.43%, to make up for some recent weakness. Gold attempted again to recapture its $1,300 level but fell short. Not falling short was the US Dollar (UUP), which bounced off its recent low in a successful attempt to stay above its 50-day M/A.
- ETFs in the Spotlight (updated for 2017)
In case you missed the announcement and description of this section, you can read it here again.
It features 10 broadly diversified and sector ETFs from my HighVolume list as posted every Saturday. Furthermore, they are screened for the lowest MaxDD% number meaning they have been showing better resistance to temporary sell offs than all others over the past year.
The below table simply demonstrates the magnitude with which some of the ETFs are fluctuating in regards to their positions above or below their respective individual trend lines (%M/A). A break below, represented by a negative number, shows weakness, while a break above, represented by a positive percentage, shows strength.
For hundreds of ETF choices, be sure to reference Thursday’s StatSheet.
Year to date, here’s how the 2017 candidates have fared so far:
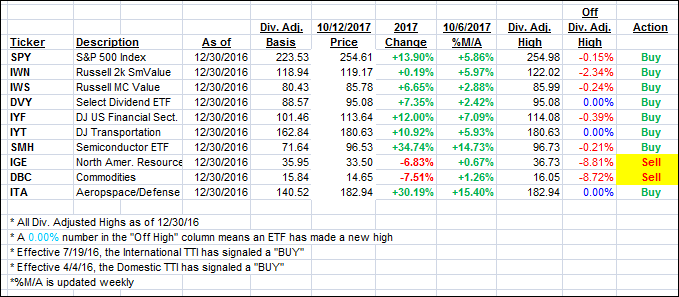
Again, the %M/A column above shows the position of the various ETFs in relation to their respective long term trend lines, while the trailing sell stops are being tracked in the “Off High” column. The “Action” column will signal a “Sell” once the -7.5% point has been taken out in the “Off High” column.
- Trend Tracking Indexes (TTIs)
Our Trend Tracking Indexes (TTIs) stayed close to their unchanged level.
Here’s how we closed 10/12/2017:
Domestic TTI: +3.17% (last close +3.17%)—Buy signal effective 4/4/2016
International TTI: +7.41% (last close +7.44%)—Buy signal effective 7/19/2016
Disclosure: I am obliged to inform you that I, as well as my advisory clients, own some of the ETFs listed in the above table. Furthermore, they do not represent a specific investment recommendation for you, they merely show which ETFs from the universe I track are falling within the guidelines specified.
Contact Ulli