
- Moving the Markets
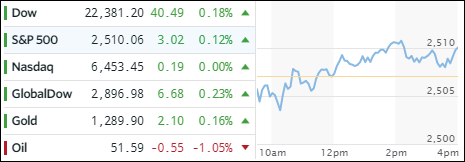
After an early slide, the major indexes managed to do a repeat pattern of what we’ve seen for the last year or so and that is to slowly crawl back to conquer the unchanged line. Today was no different, as worries about the complexity of the new tax code, concerns over deficits and the impact of special interest groups to derail the plan kept a lid on bullish euphoria and limited any advances. In the end, the trading range was tight with stocks, bonds and gold registering green numbers.
In regards to ETFs, we saw mainly positive numbers with the exception being Aerospace & Defense (ITA) showing a loss of -0.72% and Emerging Markets (SCHE) with -0.15%. On the plus side, International SmallCaps (SCHC) ruled with a gain of +0.68%, which was closely followed by Semiconductors (SMH) with +0.64%; a nice performance considering the Nasdaq ending flat.
The yield on the 10-year bond was unchanged at 2.31%, but that did not help the 20-year bond price (TLT). It slipped again, today by -0.30%, and has now surrendered 2/3 of its gains from its recent rally (August to early September).
After 3 days of advances, the US Dollar (UUP) pulled back -0.29% while spending the day in a tiny trading range.
- ETFs in the Spotlight (updated for 2017)
In case you missed the announcement and description of this section, you can read it here again.
It features 10 broadly diversified and sector ETFs from my HighVolume list as posted every Saturday. Furthermore, they are screened for the lowest MaxDD% number meaning they have been showing better resistance to temporary sell offs than all others over the past year.
The below table simply demonstrates the magnitude with which some of the ETFs are fluctuating in regards to their positions above or below their respective individual trend lines (%M/A). A break below, represented by a negative number, shows weakness, while a break above, represented by a positive percentage, shows strength.
For hundreds of ETF choices, be sure to reference Thursday’s StatSheet.
Year to date, here’s how the 2017 candidates have fared so far:
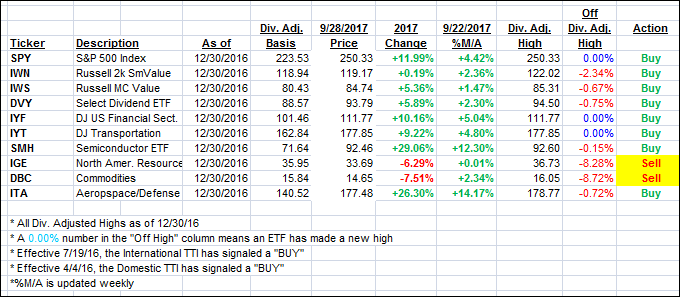
Again, the %M/A column above shows the position of the various ETFs in relation to their respective long term trend lines, while the trailing sell stops are being tracked in the “Off High” column. The “Action” column will signal a “Sell” once the -7.5% point has been taken out in the “Off High” column.
- Trend Tracking Indexes (TTIs)
Our Trend Tracking Indexes (TTIs) changed only slightly as the intra-day trend was predominantly sideways.
Here’s how we closed 9/28/2017:
Domestic TTI: +2.78% (last close +2.75%)—Buy signal effective 4/4/2016
International TTI: +6.58% (last close +6.45%)—Buy signal effective 7/19/2016
Disclosure: I am obliged to inform you that I, as well as my advisory clients, own some of the ETFs listed in the above table. Furthermore, they do not represent a specific investment recommendation for you, they merely show which ETFs from the universe I track are falling within the guidelines specified.
Contact Ulli