
- Moving the Markets
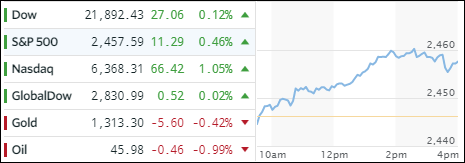
Even though I was a little facetious yesterday when commenting that the S&P needs to rally for the remaining 3 sessions of August to maintain its spotless record of rising every month, today was a step in the right direction. The Dow and Nasdaq managed to climb into the “green,” and the S&P needs to only make up 0.5% by tomorrow to accomplish the feat of 8 consecutive months of gains.
Helping the bullish cause, in the face of continuing geopolitical tensions between the U.S. and N. Korea and more fallout from Harvey, were a couple of strong economic reports namely an alleged improved economic expansion in the second quarter along with ADP indicating that private-sector employers added 237k jobs in August, which was far above the expected 185k. Only good news was accepted and mattered today, despite the fact that valuations are lofty and not necessarily representative of the real economy.
Be that as it may, equities were in rally mode and, with the Nasdaq being the lead dog, it comes as no surprise that Semiconductors (SMH) took 1st place with a solid +1.40%. SmallCaps (SCHA) had a nice day for a change, after recent weakness, and rebounded +0.71%. MidCaps (SCHM) ended up in 3rd place by adding +0.58%, closely followed by LargeCaps (SCHX) with +0.53%.
Yields on the 10-year bond rose 2 basis points pulling the 20-year bond off its high for the year by a tiny -0.03%. Gold dropped a fraction of a percent but remains above the widely followed $1,300 level. The whipping boy of the year, AKA the US Dollar (UUP), gapped higher and gained +0.63%.
- ETFs in the Spotlight (updated for 2017)
In case you missed the announcement and description of this section, you can read it here again.
It features 10 broadly diversified and sector ETFs from my HighVolume list as posted every Saturday. Furthermore, they are screened for the lowest MaxDD% number meaning they have been showing better resistance to temporary sell offs than all others over the past year.
The below table simply demonstrates the magnitude with which some of the ETFs are fluctuating in regards to their positions above or below their respective individual trend lines (%M/A). A break below, represented by a negative number, shows weakness, while a break above, represented by a positive percentage, shows strength.
For hundreds of ETF choices, be sure to reference Thursday’s StatSheet.
Year to date, here’s how the 2017 candidates have fared so far:
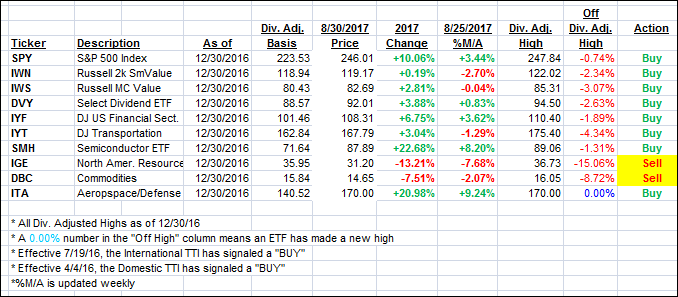
Again, the %M/A column above shows the position of the various ETFs in relation to their respective long term trend lines, while the trailing sell stops are being tracked in the “Off High” column. The “Action” column will signal a “Sell” once the -7.5% point has been taken out in the “Off High” column.
- Trend Tracking Indexes (TTIs)
Our Trend Tracking Indexes (TTIs) rallied in tandem today as some good economic reports overshadowed the ongoing warmongering talk.
Here’s how we closed 8/30/2017:
Domestic TTI: +2.61% (last close +2.36%)—Buy signal effective 4/4/2016
International TTI: +5.76% (last close +5.58%)—Buy signal effective 7/19/2016
Disclosure: I am obliged to inform you that I, as well as my advisory clients, own some of the ETFs listed in the above table. Furthermore, they do not represent a specific investment recommendation for you, they merely show which ETFs from the universe I track are falling within the guidelines specified.
Contact Ulli