
- Moving the Markets
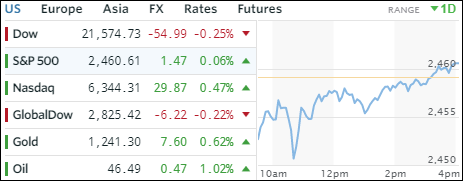
The major indexes spent most of the day below unchanged line. However, thanks to the upward bias in part caused by Netflix reaching nosebleed territory with a P/E ratio of 197, higher than Amazon’s 190, the Nasdaq set another record. Netflix surged over 13% thanks to a surprise jump in international subscriber numbers.
The Dow and S&P lagged but managed to climb out of an early hole as the VIX was pushed down to ensure a positive close. Amazingly, the Nasdaq managed this melt-up despite a negative advance/decline ratio, which simply confirms that it was all about Netflix with the rest of the market meandering.
US macro data kept weakening, which caused bond yields to tumble to their lowest level since June and in the process helping equities to wipe out early losses. The 20-year T-bond was the beneficiary and gained +0.87% on the day. Oil rebounded and gold had another good session by conquering its 200-day M/A. Of course, the has to be a loser and that was again the US dollar (UUP) which, after 2 days of stability, got spanked again and closed down -0.53%, its lowest point since early September 2016. YTD, UUP has now lost a staggering -8.9%.
- ETFs in the Spotlight (updated for 2017)
In case you missed the announcement and description of this section, you can read it here again.
It features 10 broadly diversified and sector ETFs from my HighVolume list as posted every Saturday. Furthermore, they are screened for the lowest MaxDD% number meaning they have been showing better resistance to temporary sell offs than all others over the past year.
The below table simply demonstrates the magnitude with which some of the ETFs are fluctuating in regards to their positions above or below their respective individual trend lines (%M/A). A break below, represented by a negative number, shows weakness, while a break above, represented by a positive percentage, shows strength.
For hundreds of ETF choices, be sure to reference Thursday’s StatSheet.
Year to date, here’s how the 2017 candidates have fared so far:
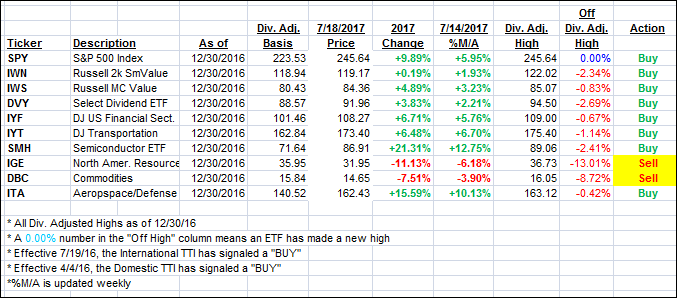
Again, the %M/A column above shows the position of the various ETFs in relation to their respective long term trend lines, while the trailing sell stops are being tracked in the “Off High” column. The “Action” column will signal a “Sell” once the -7.5% point has been taken out in the “Off High” column.
- Trend Tracking Indexes (TTIs)
Our Trend Tracking Indexes (TTIs) hardly moved as the major indexes changed only slightly.
Here’s how we closed 7/18/2017:
Domestic TTI: +3.54% (last close +3.45%)—Buy signal effective 4/4/2016
International TTI: +8.39% (last close +8.41%)—Buy signal effective 7/19/2016
Disclosure: I am obliged to inform you that I, as well as my advisory clients, own some of the ETFs listed in the above table. Furthermore, they do not represent a specific investment recommendation for you, they merely show which ETFs from the universe I track are falling within the guidelines specified.
Contact Ulli