
- Moving the Markets
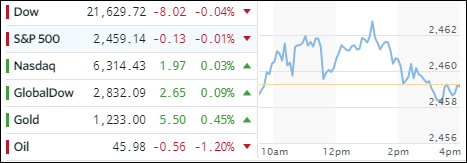
The major indexes zigzagged throughout the day but stayed close to the unchanged line, and that’s where we ended up with only the Nasdaq closing fractionally higher. On the front burner is much anticipation about the upcoming earnings season with some key quarterly results due out later this week.
On the day, healthcare and financials dipped a modest -0.3% while utilities gained 0.4%, but the retail ETF XRT turned out to be the winner by adding +0.95% which, when looking at the 1 year chart, looks like another dead cat bounce.
China stocks took an overnight dive with their SmallCaps tumbling to a low last seen in early 2015. That brings the loss to 10%; just for the last week. Interest rates retreated with the 20-year T-bond ETF TLT gaining +0.28%. The US dollar meandered and UUP closed unchanged. Crude oil leaked lower, but the precious metals continued to show signs of life by closing higher for the 5th out of the last 6 days.
- ETFs in the Spotlight (updated for 2017)
In case you missed the announcement and description of this section, you can read it here again.
It features 10 broadly diversified and sector ETFs from my HighVolume list as posted every Saturday. Furthermore, they are screened for the lowest MaxDD% number meaning they have been showing better resistance to temporary sell offs than all others over the past year.
The below table simply demonstrates the magnitude with which some of the ETFs are fluctuating in regards to their positions above or below their respective individual trend lines (%M/A). A break below, represented by a negative number, shows weakness, while a break above, represented by a positive percentage, shows strength.
For hundreds of ETF choices, be sure to reference Thursday’s StatSheet.
Year to date, here’s how the 2017 candidates have fared so far:
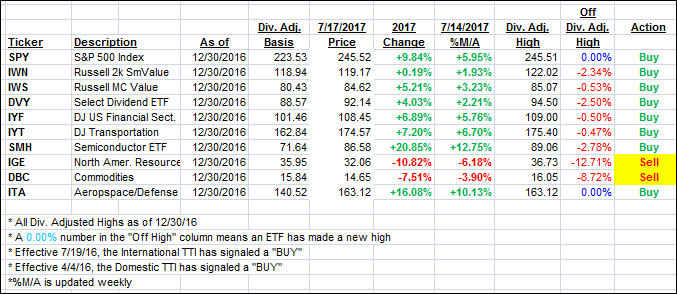
Again, the %M/A column above shows the position of the various ETFs in relation to their respective long term trend lines, while the trailing sell stops are being tracked in the “Off High” column. The “Action” column will signal a “Sell” once the -7.5% point has been taken out in the “Off High” column.
- Trend Tracking Indexes (TTIs)
Our Trend Tracking Indexes (TTIs) stayed just about unchanged.
Here’s how we closed 7/17/2017:
Domestic TTI: +3.45% (last close +3.43%)—Buy signal effective 4/4/2016
International TTI: +8.41% (last close +8.41%)—Buy signal effective 7/19/2016
Disclosure: I am obliged to inform you that I, as well as my advisory clients, own some of the ETFs listed in the above table. Furthermore, they do not represent a specific investment recommendation for you, they merely show which ETFs from the universe I track are falling within the guidelines specified.
Contact Ulli