
ETF Tracker StatSheet
https://theetfbully.com/2017/07/weekly-statsheet-etf-tracker-newsletter-updated-07132017/
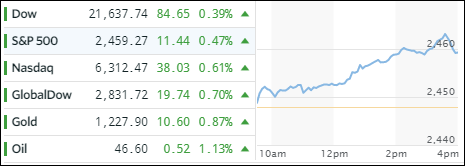
WEAK DATA PROPELS INDEXES TO RECORD TERRITORY
- Moving the Markets
It did not matter that consumer sentiment tumbled to its lowest since the election or that Retail sales were down -0.2% posting their weakest growth in 3 years, nor suggestions that Q2 GDP estimates might be revised sharply lower.
It was simply another day where bad news was good news, and the major indexes reacted accordingly by closing out the week solidly in the green. The S&P 500 and Dow managed to hit intra-day highs while the Nasdaq had its best weak of 2017. Even the recent weakness of the FANG stocks came to an end as they had their best 5 trading sessions in 3 months.
The 20-year T-Bond swung in a wide range but closed up only a scant +0.12%. The US dollar took another licking, gapped down and made new lows for the year with UUP dropping -0.61%.
It was another wild day in the markets, which ZH summed up nicely:
After months of hawkishness, Yellen drops a slight hint at ‘dovishness’ on the rate-hike trajectory and stocks soar to record highs, VIX closes at a record weekly low, bonds rally, crude oil rips, and gold has best week in months…oh, and macro data dumps!
- ETFs in the Spotlight (updated for 2017)
In case you missed the announcement and description of this section, you can read it here again.
It features 10 broadly diversified and sector ETFs from my HighVolume list as posted every Saturday. Furthermore, they are screened for the lowest MaxDD% number meaning they have been showing better resistance to temporary sell offs than all others over the past year.
The below table simply demonstrates the magnitude with which some of the ETFs are fluctuating in regards to their positions above or below their respective individual trend lines (%M/A). A break below, represented by a negative number, shows weakness, while a break above, represented by a positive percentage, shows strength.
For hundreds of ETF choices, be sure to reference Thursday’s StatSheet.
Year to date, here’s how the 2017 candidates have fared so far:
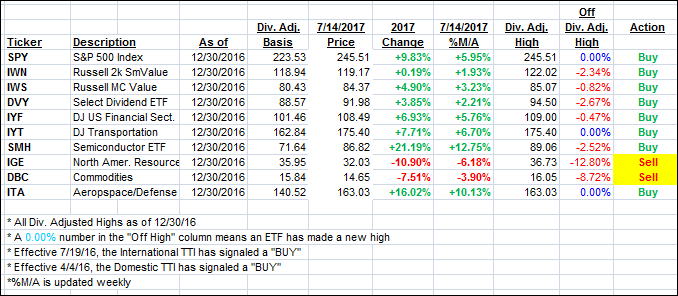
Again, the %M/A column above shows the position of the various ETFs in relation to their respective long term trend lines, while the trailing sell stops are being tracked in the “Off High” column. The “Action” column will signal a “Sell” once the -7.5% point has been taken out in the “Off High” column.
- Trend Tracking Indexes (TTIs)
Our Trend Tracking Indexes (TTIs) inched up as the major indexes continued their bullish ramp.
Here’s how we closed 7/14/2017:
Domestic TTI: +3.43% (last close +3.40%)—Buy signal effective 4/4/2016
International TTI: +8.41% (last close +8.28%)—Buy signal effective 7/19/2016
Disclosure: I am obliged to inform you that I, as well as my advisory clients, own some of the ETFs listed in the above table. Furthermore, they do not represent a specific investment recommendation for you, they merely show which ETFs from the universe I track are falling within the guidelines specified.
————————————————————-
READER Q & A FOR THE WEEK
All Reader Q & A’s are listed at our web site!
Check it out at:
https://theetfbully.com/questions-answers/
———————————————————-
WOULD YOU LIKE TO HAVE YOUR INVESTMENTS PROFESSIONALLY MANAGED?
Do you have the time to follow our investment plans yourself? If you are a busy professional who would like to have his portfolio managed using our methodology, please contact me directly or get more details at:
https://theetfbully.com/personal-investment-management/
———————————————————
Back issues of the ETF/No Load Fund Tracker are available on the web at:
https://theetfbully.com/newsletter-archives/
Contact Ulli