
- Moving the Markets
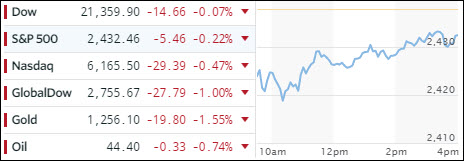
The reaction to the Fed’s hawkish tone on Wednesday continued to take its toll on the markets for the second day, with the major indexes hovering below the unchanged line all day. The mood on Wall Street could be best described as “cautious” with news of a special counsel investigating allegations, as to whether Trump obstructed justice, not helping matters. The markets hate uncertainty and that’s what we got today.
As has been the case lately, the Nasdaq, down 4 of the last 5 days, took the brunt of the beating as tech shares (XLK) extended its month-to-date decline to -1.7%. The FANG stocks got hammered to an 8-week low, but dip buyers stepped in late today to minimize the session’s losses, however, they still closed below yesterday’s lows with Netflix (NFLX) showing the largest drop.
It appears that the Fed has not noticed the collapse of America’s economy but the US dollar has, as it continues on its 2017 downward path having lost -5.6% of its value. Although today, UUP showed a rebound of +0.60%, which sent gold and silver lower. Interest rates rose a tad with the 20-year T-bond losing -0.16%.
- ETFs in the Spotlight (updated for 2017)
In case you missed the announcement and description of this section, you can read it here again.
It features 10 broadly diversified and sector ETFs from my HighVolume list as posted every Saturday. Furthermore, they are screened for the lowest MaxDD% number meaning they have been showing better resistance to temporary sell offs than all others over the past year.
The below table simply demonstrates the magnitude with which some of the ETFs are fluctuating in regards to their positions above or below their respective individual trend lines (%M/A). A break below, represented by a negative number, shows weakness, while a break above, represented by a positive percentage, shows strength.
For hundreds of ETF choices, be sure to reference Thursday’s StatSheet.
Year to date, here’s how the 2017 candidates have fared so far:
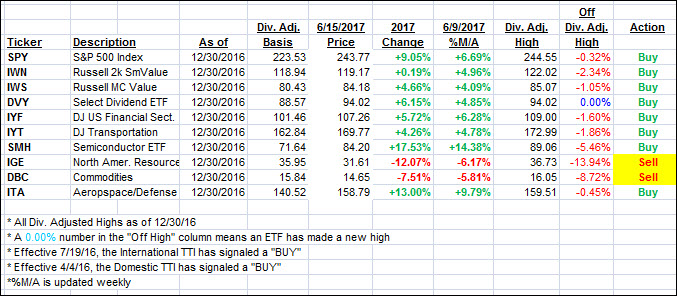
Again, the %M/A column above shows the position of the various ETFs in relation to their respective long term trend lines, while the trailing sell stops are being tracked in the “Off High” column. The “Action” column will signal a “Sell” once the -7.5% point has been taken out in the “Off High” column.
- Trend Tracking Indexes (TTIs)
Our Trend Tracking Indexes (TTIs) slipped as the major indexes struggled trying to climb towards the unchanged line.
Here’s how we closed 6/15/2017:
Domestic TTI: +3.56% (last close +3.73%)—Buy signal effective 4/4/2016
International TTI: +7.11% (last close +7.65%)—Buy signal effective 7/19/2016
Disclosure: I am obliged to inform you that I, as well as my advisory clients, own some of the ETFs listed in the above table. Furthermore, they do not represent a specific investment recommendation for you, they merely show which ETFs from the universe I track are falling within the guidelines specified.
Contact Ulli