
- Moving the Markets
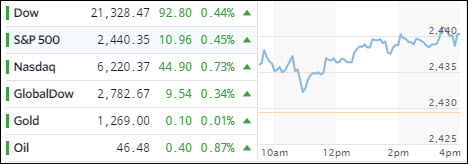
The pullback of the last 2 days ended, at least for the time being, with the Nasdaq and S&P 500 moving into record territory, while the Dow touched an all-time high on an intra-day basis as the Fed started its two-day meeting on interest rates. Even the Russell 2000 hit a record high at a moment in time when its 2017 EPS expectations hit 2017 lows. Makes perfect sense to me…
The result of the FOMC conference will be announced tomorrow with market observers holding a nearly unanimous view that interest rates will be hiked by +0.25%. That means traders are comfortable and are assuming that the Fed will balance things in a way so that a tighter monetary policy does not have a negative effect on growth. Hmm, given that economic data points have collapsed that will be quite a magic act for the Fed to perform.
Interest rates vacillated but ended the day unchanged with the 10-year T-Bond maintaining its 2.21% yield. The US dollar slipped for the second day in a row with UUP closing down -0.12%.
- ETFs in the Spotlight (updated for 2017)
In case you missed the announcement and description of this section, you can read it here again.
It features 10 broadly diversified and sector ETFs from my HighVolume list as posted every Saturday. Furthermore, they are screened for the lowest MaxDD% number meaning they have been showing better resistance to temporary sell offs than all others over the past year.
The below table simply demonstrates the magnitude with which some of the ETFs are fluctuating in regards to their positions above or below their respective individual trend lines (%M/A). A break below, represented by a negative number, shows weakness, while a break above, represented by a positive percentage, shows strength.
For hundreds of ETF choices, be sure to reference Thursday’s StatSheet.
Year to date, here’s how the 2017 candidates have fared so far:
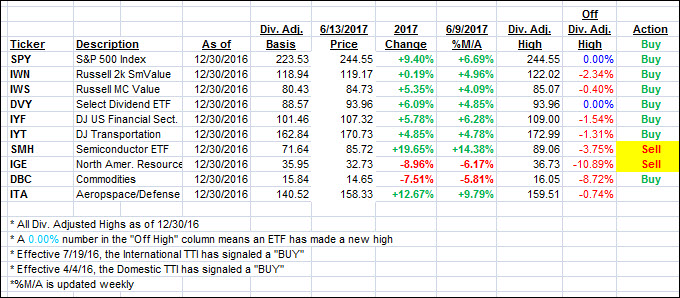
Again, the %M/A column above shows the position of the various ETFs in relation to their respective long term trend lines, while the trailing sell stops are being tracked in the “Off High” column. The “Action” column will signal a “Sell” once the -7.5% point has been taken out in the “Off High” column.
- Trend Tracking Indexes (TTIs)
Our Trend Tracking Indexes (TTIs) reversed as the S&P and Nasdaq scored record highs.
Here’s how we closed 6/13/2017:
Domestic TTI: +3.77% (last close +3.52%)—Buy signal effective 4/4/2016
International TTI: +7.85% (last close +7.30%)—Buy signal effective 7/19/2016
Disclosure: I am obliged to inform you that I, as well as my advisory clients, own some of the ETFs listed in the above table. Furthermore, they do not represent a specific investment recommendation for you, they merely show which ETFs from the universe I track are falling within the guidelines specified.
Contact Ulli