
- Moving the Markets
There simply weren’t any news reports positive enough to keep the major indexes above the unchanged line. First, it was the Fed and its mouthpieces pretty much talking down the markets. ZH summed it up as follows:
Yellen – “We have been in an economy with low interest rates for some time, and that influences asset prices… Asset valuations are somewhat rich by traditional valuations like price-earnings ratios… Some asset valuations look high. There is no certainty about that.”
Williams – “I am somewhat concerned about the complacency in the market. If you look at these measures of uncertainty, like the VIX measure, or other indicators, there seems to be a priced-to-perfection attitude out there… The stock market still seems to be running very much on fumes…”
Fischer – Calls for “close monitoring” of rising risk appetites…”Equity P/E ratios are near top of historical levels… it would be foolish to think all risks eliminated… Sees notable uptick in risk appetites in asset markets… Corporate sector notably leveraged…”
Later in the session, downward momentum accelerated when Republican Senate leaders postponed the vote on the controversial health-care bill until after the July 4th holiday, which did not exactly instill confidence in its outcome.
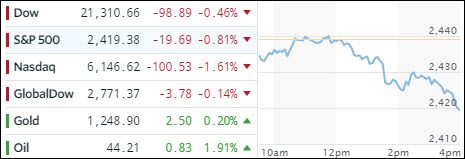
The Nasdaq got clobbered the most by losing -1.61% and is now showing a negative return for June. It’s not surprising that the FANGs were hammered as well dropping 4% from yesterday’s close.
Bonds got hit hard as the 10-year yield jumped 7 basis points to 2.21%, which sent the 20-year T-Bond (TLT) sliding and surrendering -1.07%. Not to be outdone, the US Dollar tumbled along losing -1.11% (UUP) in the process wiping out recent gains and ending up back at October 2017 lows. In other words, the entire “Trump US dollar bump” has been more than wiped out with only equities not having gotten the message.
- ETFs in the Spotlight (updated for 2017)
In case you missed the announcement and description of this section, you can read it here again.
It features 10 broadly diversified and sector ETFs from my HighVolume list as posted every Saturday. Furthermore, they are screened for the lowest MaxDD% number meaning they have been showing better resistance to temporary sell offs than all others over the past year.
The below table simply demonstrates the magnitude with which some of the ETFs are fluctuating in regards to their positions above or below their respective individual trend lines (%M/A). A break below, represented by a negative number, shows weakness, while a break above, represented by a positive percentage, shows strength.
For hundreds of ETF choices, be sure to reference Thursday’s StatSheet.
Year to date, here’s how the 2017 candidates have fared so far:
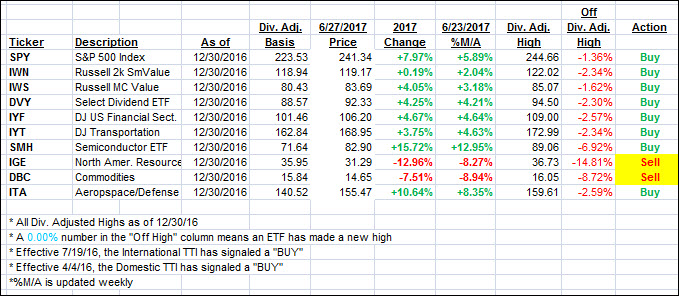
Again, the %M/A column above shows the position of the various ETFs in relation to their respective long term trend lines, while the trailing sell stops are being tracked in the “Off High” column. The “Action” column will signal a “Sell” once the -7.5% point has been taken out in the “Off High” column.
- Trend Tracking Indexes (TTIs)
Our Trend Tracking Indexes (TTIs) slipped as bad news was in charge of market direction.
Here’s how we closed 6/27/2017:
Domestic TTI: +3.12% (last close +3.54%)—Buy signal effective 4/4/2016
International TTI: +7.23% (last close +7.43%)—Buy signal effective 7/19/2016
Disclosure: I am obliged to inform you that I, as well as my advisory clients, own some of the ETFs listed in the above table. Furthermore, they do not represent a specific investment recommendation for you, they merely show which ETFs from the universe I track are falling within the guidelines specified.
Contact Ulli