
ETF Tracker StatSheet
https://theetfbully.com/?p=18769&preview=true
WAR MONGERING AND POOR JOBS REPORT EQUAL UNCERTAINTY
- Moving the Markets
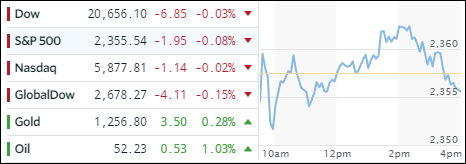
While stock futures took a dive last night after Trump’s unveiling that he ordered the US military to lob some 59 tomahawk cruise missiles into Syria, things turned around this morning as it appeared that the conflict will likely be contained—at least for the time being.
Then the markets got hit with the worst jobs report in 11 months as only 98,000 jobs were added but the unemployment rate dropped to 4.5%. After a brief pullback, the usual ramp occurred but upward momentum did not hold, and the major indexes sold off late in the day to close a tad below the unchanged line.
Overall, it was a session marked by confusion with only gold and oil hanging on to some of their early gains. Interest rates surged with the 10-year Treasury yield gaining 4 points or +1.71%. With higher yield, the US dollar got a little boost and added +0.54% to finally conquer the 101 level again after having vacillated the past 4 weeks below it. In a sign of bullishness, it also managed to close above 50-day M/A.
- ETFs in the Spotlight (updated for 2017)
In case you missed the announcement and description of this section, you can read it here again.
It features 10 broadly diversified and sector ETFs from my HighVolume list as posted every Saturday. Furthermore, they are screened for the lowest MaxDD% number meaning they have been showing better resistance to temporary sell offs than all others over the past year.
The below table simply demonstrates the magnitude with which some of the ETFs are fluctuating in regards to their positions above or below their respective individual trend lines (%M/A). A break below, represented by a negative number, shows weakness, while a break above, represented by a positive percentage, shows strength.
For hundreds of ETF choices, be sure to reference Thursday’s StatSheet.
Year to date, here’s how the 2017 candidates have fared so far:
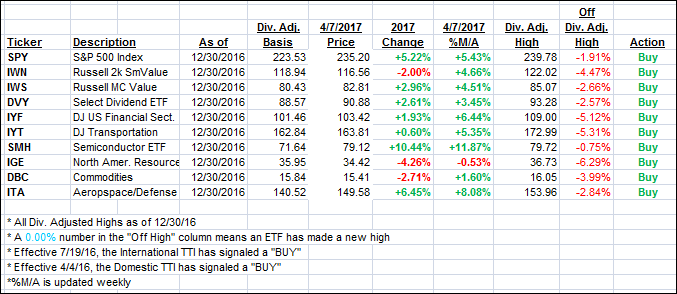
Again, the %M/A column above shows the position of the various ETFs in relation to their respective long term trend lines, while the trailing sell stops are being tracked in the “Off High” column. The “Action” column will signal a “Sell” once the -7.5% point has been taken out in the “Off High” column.
- Trend Tracking Indexes (TTIs)
Our Trend Tracking Indexes (TTIs) pulled back as today’s market action was mired in uncertainty.
Here’s how we closed 4/7/2017:
Domestic TTI: +2.20% (last close +2.37%)—Buy signal effective 4/4/2016
International TTI: +4.76% (last close +5.16%)—Buy signal effective 7/19/2016
Disclosure: I am obliged to inform you that I, as well as my advisory clients, own some of the ETFs listed in the above table. Furthermore, they do not represent a specific investment recommendation for you, they merely show which ETFs from the universe I track are falling within the guidelines specified.
————————————————————-
READER Q & A FOR THE WEEK
All Reader Q & A’s are listed at our web site!
Check it out at:
https://theetfbully.com/questions-answers/
———————————————————-
WOULD YOU LIKE TO HAVE YOUR INVESTMENTS PROFESSIONALLY MANAGED?
Do you have the time to follow our investment plans yourself? If you are a busy professional who would like to have his portfolio managed using our methodology, please contact me directly or get more details at:
https://theetfbully.com/personal-investment-management/
———————————————————
Back issues of the ETF/No Load Fund Tracker are available on the web at:
https://theetfbully.com/newsletter-archives/
Contact Ulli